In this guide, you’ll learn how to integrate Prometheus and Grafana on Kubernetes using Helm. Additionally, you’ll learn how to create a simple dashboard on Grafana. Prometheus and Grafana are two of the most popular open-source monitoring tools for Kubernetes. Learning how to integrate them using Helm will give you the ability to easily monitor your Kubernetes cluster and troubleshoot problems. You can also gain a deeper understanding of your cluster’s health and performance. It will keep track of resources and performance metrics on the Kubernetes cluster.
As mentioned, Prometheus and Grafana are popular tools for monitoring container orchestration platforms. The two most popular container orchestration tools are Docker Swarm and Kubernetes.
Prerequisites
To follow along with this guide, you’ll need to:
- Install Docker: to install Docker into your machine, check out the Docker official documentation.
- Install Kubectl: this allows you to communicate with your Kubernetes cluster. To install the Kubectl tool on your local machine, follow the official Kubectl documentation guide.
- Have basic knowledge of Kubernetes: ensure that you have some knowledge of Kubernetes. You can read the Kubernetes official documentation or download Semaphore’s free ebook: CI/CD with Docker and Kubernetes which requires no prior knowledge of Docker or Kubernetes.
- Set up a Kubernetes Cluster: you’ll install Prometheus and Grafana on your Kubernetes cluster. This guide we’ll use Minikube. It is a free local Kubernetes cluster.
You can also use other managed cloud-based Kubernetes services like:
- Google Kubernetes Engine (GKE).
- Azure Kubernetes Service (AKS).
- Amazon Elastic Kubernetes Service (EKS).
- DigitalOcean Kubernetes Service(DOKS).
NOTE: You may have to pay to use many cloud-based Kubernetes services. Some may have a free plan.
What is Prometheus?
Prometheus is an open-source DevOps tool. It provides monitoring and real-time alerting functionality for container orchestration platforms like Kubernetes. It collects and stores the metrics from the platform as time series data. It has an out-of-box capability for monitoring the container orchestration platform. It acts as a data source for other data visualization libraries like Grafana.
The metrics that Prometheus collects from the Kubernetes cluster are:
- Kubernetes cluster health.
- CPU status.
- Memory usage.
- Kubernetes nodes status.
- Reports on potential performance bottlenecks.
- Performance metrics.
- Server resources.
What is Grafana?
Grafana is a multi-platform, open-source online application for analytics and interactive visualization. When you connect it to supported data sources like Prometheus, it offers:
- Interactive Dashboards.
- Interactive charts.
- Graphs.
- Alerts for the web.
Grafana enables you to query, visualize and comprehend your metrics regardless of the data source. Besides Prometheus, Grafana supports several other data sources such as:
- InfluxDB.
- AzureMonitor.
- Datadog.
- Graphite.
- AWS CloudWatch.
- PostgreSQL.
- Microsoft SQL Server (MSSQL).
- Elasticsearch.
- Google Cloud Monitoring.
- Azure Monitor.
- MySQL.
- Alertmanager.
- Loki.
You have the option of creating your dashboards from scratch. You can also import those that Grafana already offers and customize them to meet your needs. Most DevOps professionals use Grafana and Prometheus to create a powerful time-series database with data visualization dashboards.
We will create a dashboard for visualizing the metrics collected from the Prometheus data source.
Prometheus’ architecture
The diagram below shows Prometheus’ components and how Prometheus works:

These are the components of Prometheus:
- Prometheus Server is the core component in the Prometheus architecture. It is where the actual monitoring job occurs.
- Alertmanager alerts users via email and other communication channels, such as Slack.
- Pushgateway can support temporary jobs. It allows users to push time series data to the Prometheus targets. It also handles metrics for short-lived jobs.
The prometheus server can further be split into three components:
- Data Retrieval Worker scraps and collects metrics data from the container orchestration platform. It then converts the metrics into time series data. It gathers metrics from many sources, specified in its setups.
- Time Series Database stores the time series data from the data retrieval component.
- HTTP Server responds to requests and PromQL queries for the time series data. It then presents the information in a web user interface or dashboard. It can either use a third-party platform like Grafana or the inbuilt Prometheus Web UI.
Benefits of setting up Prometheus and Grafana for monitoring a container orchestration platform
Setting up Prometheus and Grafana for monitoring gives us many benefits:
- You get a complete end-to-end solution for observing and monitoring a Kubernetes cluster.
- You can query the metrics using Prometheus PromQL query language.
- If you have a microservice architecture, Prometheus keeps track of all your microservices simultaneously.
- When a service fails, you get an immediate alert.
- The Grafana dashboard provides performance and health reports for your clusters.
When it comes to integrating Prometheus and Grafana on Kubernetes, there are two popular ways that developers adopt:
- Manual Kubernetes deployment: in this method, you have to write Kubernetes Deployments and Services YAML files. You’ll have to write YAML for both Prometheus and Grafana applications. In the YAML file, specify every configuration for integrating Prometheus and Grafana on Kubernetes. You’ll then deploy these files to your Kubernetes cluster for Prometheus and Grafana to work.
You can end up with many YAML files which can be tiresome for most DevOps practitioners. If you make a mistake in any YAML file, you’ll not be able to integrate Prometheus and Grafana on Kubernetes.
- Using Helm: this is the simplest and the easiest way for deploying any application container to Kubernetes. Helm is the official package manager for Kubernetes. With Helm, you can streamline Kubernetes application installation, deployment, and management. Helm packages and bundles the Kubernetes application into a Helm Chart.
A Helm Chart is a collection of all the YAML files:
- Deployments.
- Services.
- Secrets.
- ConfigMaps manifests.
You’ll use these files to deploy the application container to Kubernetes. Instead of creating individual YAML files for each application container, Helm allows you to download pre-existing Helm charts that already have manifest YAML files.
Getting started with Helm and Helm Charts
ArtifactHub provides public and private repositories for Helm Charts. We’ll use these Helm Charts to set up the pods and services in your Kubernetes cluster.
The Helm community creates, manages, and maintains the Helm charts for various Kubernetes applications. They are always updated. Helm charts are reusable and simple to install. To integrate Prometheus and Grafana on Kubernetes using Helm, let’s start by installing Helm.
Installing Helm
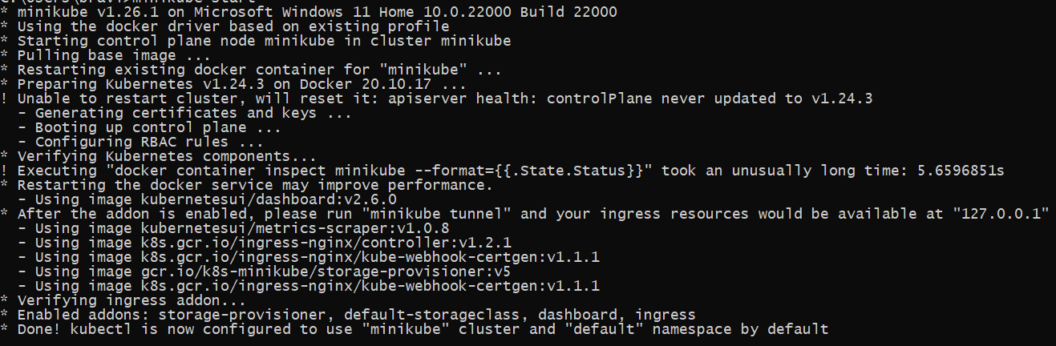
Before you install Helm, you must start your Minikube Kubernetes using the following command:
minikube start --driver=dockerThe image below shows Minikube running. The Kubectl tool is now configured to use Minikube.
Next, install Helm with the following command (depending on your operating system):
- Installing Helm on Linux
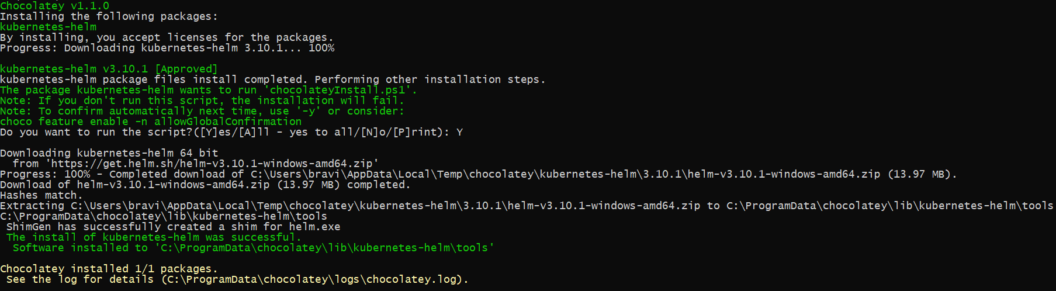
sudo apt-get install helm- Installing Helm on Windows:
choco install Kubernetes-helm- Installing Helm on macOS
brew install helmNOTE: You can check out the official Helm documentation guide if you have issues.
The image below shows Helm installation on a Windows machine:
Helm Commands
To get all the Helm commands, run this command:
helmThe command output:
The Kubernetes package manager

Common actions for Helm:

- helm search:    search for charts
- helm pull:      download a chart to your local directory to view
- helm install:   upload the chart to Kubernetes
- helm list:      list releases of charts

Usage:
  helm [command]

Available Commands:
  completion  generate autocompletion scripts for the specified shell
  create      create a new chart with the given name
  dependency  manage a chart's dependencies
  env         helm client environment information
  get         download extended information of a named release
  help        Help about any command
  history     fetch release history
  install     install a chart
  lint        examine a chart for possible issues
  list        list releases
  package     package a chart directory into a chart archive
  plugin      install, list, or uninstall Helm plugins
  pull        download a chart from a repository and (optionally) unpack it in local directory
  push        push a chart to remote
  registry    login to or logout from a registry
  repo        add, list, remove, update, and index chart repositories
  rollback    roll back a release to a previous revision
  search      search for a keyword in charts
  show        show information of a chart
  status      display the status of the named release
  template    locally render templates
  test        run tests for a release
  uninstall   uninstall a release
  upgrade     upgrade a release
  verify      verify that a chart at the given path has been signed and is valid
  version     print the client version information

Use "helm [command] --help" for more information about a command.
The most common Helm commands are:
- helm search: search for a Helm Chart in the ArtifactHub repository.
- helm pull: pull and download a Helm Chart from the ArtifactHub repository.
- helm install: upload and deploy the Helm Chart to the Kubernetes cluster.
- helm list: lists all the Helm charts deployed in your Kubernetes cluster.
Prometheus Helm Charts
First, we’ll search for the Prometheus Helm Charts. To search for the Prometheus Helm, run this command:
helm search hub prometheusThe command lists the following Prometheus Helm Charts:
URL CHART VERSION APP VERSION DESCRIPTION
https://artifacthub.io/packages/helm/prometheus... 25.1.0 v2.47.0 Prometheus is a monitoring system and time seri...
https://artifacthub.io/packages/helm/truecharts... 13.0.7 2.47.1 kube-prometheus-stack collects Kubernetes manif...
https://artifacthub.io/packages/helm/saurabh6-p... 0.2.0 1.1 This is a Helm Chart for Prometheus Setup.
https://artifacthub.io/packages/helm/prometheus... 13.0.0 2.22.1 Prometheus is a monitoring system and time seri...
https://artifacthub.io/packages/helm/wenerme/pr... 25.1.0 v2.47.0 Prometheus is a monitoring system and time seri...
https://artifacthub.io/packages/helm/wener/prom... 25.1.0 v2.47.0 Prometheus is a monitoring system and time seri...
https://artifacthub.io/packages/helm/romanow-he... 1.3.5 2.40.0 Prometheus collects and stores its metrics as t...
https://artifacthub.io/packages/helm/mach1el-ch... 1.0.1 v2.47.0 Prometheus Helm chart for Kubernetes
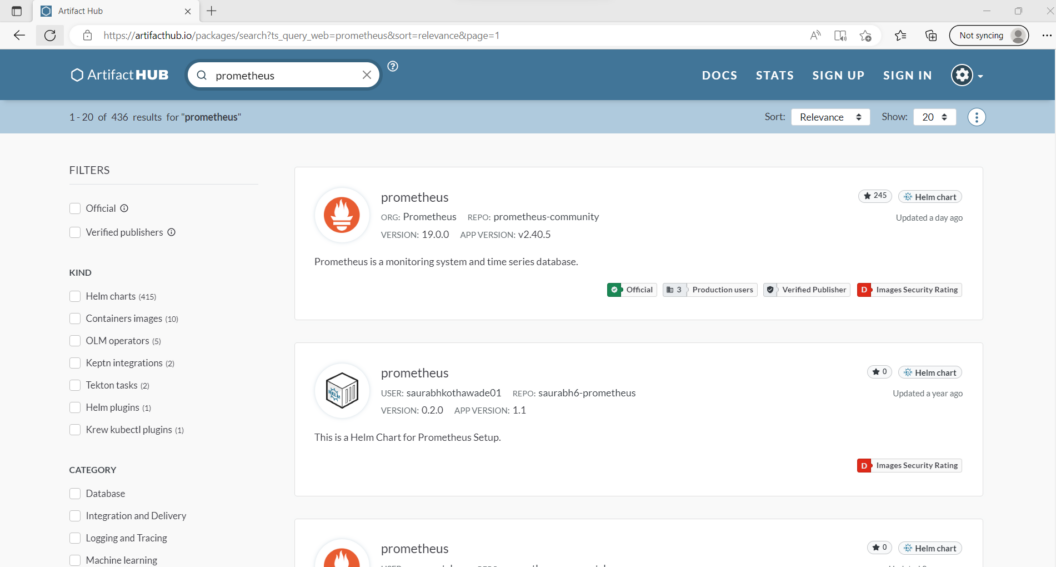
https://artifacthub.io/packages/helm/cloudposse... 0.2.1 Prometheus instance created by the CoreOS Prome...You can also go to the ArtifactHub repository and search for the official Prometheus Helm Chart as shown in the image below:
The first one on the list is the official Prometheus Helm Chart. To get this Helm chart, run this command:
helm repo add prometheus-community https://prometheus-community.github.io/helm-charts
helm repo update
Output:
"prometheus-community" has been added to your repositories
Hang tight while we grab the latest from your chart repositories...
...Successfully got an update from the "grafana" chart repository
...Successfully got an update from the "prometheus-community" chart repository
...Successfully got an update from the "bitnami" chart repository
Update Complete. ⎈Happy Helming!⎈
We have downloaded the latest version of the Prometheus.
Install Prometheus Helm Chart on Kubernetes Cluster
To install Prometheus Helm Chart on Kubernetes Cluster, run this helm install command:
helm install prometheus prometheus-community/prometheusOutput:
NAME: my-prometheus
LAST DEPLOYED: Thu Oct 12 20:06:57 2023
NAMESPACE: monitoring
STATUS: deployed
REVISION: 1
TEST SUITE: None
NOTES:
The Prometheus server can be accessed via port 80 on the following DNS name from within your cluster:
my-prometheus-server.monitoring.svc.cluster.local


Get the Prometheus server URL by running these commands in the same shell:
  export POD_NAME=$(kubectl get pods --namespace monitoring -l "app.kubernetes.io/name=prometheus,app.kubernetes.io/instance=my-prometheus" -o jsonpath="{.items[0].metadata.name}")
  kubectl --namespace monitoring port-forward $POD_NAME 9090


The Prometheus alertmanager can be accessed via port 9093 on the following DNS name from within your cluster:
my-prometheus-alertmanager.monitoring.svc.cluster.local


Get the Alertmanager URL by running these commands in the same shell:
  export POD_NAME=$(kubectl get pods --namespace monitoring -l "app.kubernetes.io/name=alertmanager,app.kubernetes.io/instance=my-prometheus" -o jsonpath="{.items[0].metadata.name}")
  kubectl --namespace monitoring port-forward $POD_NAME 9093
#################################################################################
######   WARNING: Pod Security Policy has been disabled by default since    #####
######            it deprecated after k8s 1.25+. use                        #####
######            (index .Values "prometheus-node-exporter" "rbac"          #####
###### .          "pspEnabled") with (index .Values                         #####
######            "prometheus-node-exporter" "rbac" "pspAnnotations")       #####
######            in case you still need it.                                #####
#################################################################################


The Prometheus PushGateway can be accessed via port 9091 on the following DNS name from within your cluster:
my-prometheus-prometheus-pushgateway.monitoring.svc.cluster.local


Get the PushGateway URL by running these commands in the same shell:
  export POD_NAME=$(kubectl get pods --namespace monitoring -l "app=prometheus-pushgateway,component=pushgateway" -o jsonpath="{.items[0].metadata.name}")
  kubectl --namespace monitoring port-forward $POD_NAME 9091

For more information on running Prometheus, visit:
https://prometheus.io/
We have installed Prometheus on the Kubernetes Cluster. We can access the Prometheus server via port 80. The next step is to view the deployed Kubernetes resources. They are the pods and services the Helm Chart creates in your Kubernetes cluster.
To view the deployed Kubernetes resources, run the following kubectl command:
kubectl get allOutput:
NAME                                                        READY   STATUS    RESTARTS   AGE
pod/my-prometheus-prometheus-node-exporter-d5l8m            1/1     Running   0          27m
pod/my-prometheus-prometheus-node-exporter-kfbxb            1/1     Running   0          27m
pod/my-prometheus-prometheus-pushgateway-86d6f795cb-mlb7d   1/1     Running   0          27m
pod/my-prometheus-kube-state-metrics-6c4b65c7b9-wbh9r       1/1     Running   0          27m
pod/my-prometheus-prometheus-node-exporter-2z7rp            1/1     Running   0          27m
pod/my-prometheus-alertmanager-0                            1/1     Running   0          27m
pod/my-prometheus-server-795d8fc685-zcfct                   2/2     Running   0          27m

NAME                                             TYPE        CLUSTER-IP      EXTERNAL-IP   PORT(S)    AGE
service/my-prometheus-alertmanager-headless      ClusterIP   None            <none>        9093/TCP   27m
service/my-prometheus-server                     ClusterIP   10.43.186.10    <none>        80/TCP     27m
service/my-prometheus-prometheus-pushgateway     ClusterIP   10.43.154.83    <none>        9091/TCP   27m
service/my-prometheus-alertmanager               ClusterIP   10.43.217.41    <none>        9093/TCP   27m
service/my-prometheus-kube-state-metrics         ClusterIP   10.43.168.65    <none>        8080/TCP   27m
service/my-prometheus-prometheus-node-exporter   ClusterIP   10.43.195.241   <none>        9100/TCP   27m

NAME                                                    DESIRED   CURRENT   READY   UP-TO-DATE   AVAILABLE   NODE SELECTOR            AGE
daemonset.apps/my-prometheus-prometheus-node-exporter   3         3         3       3            3           kubernetes.io/os=linux   27m

NAME                                                   READY   UP-TO-DATE   AVAILABLE   AGE
deployment.apps/my-prometheus-prometheus-pushgateway   1/1     1            1           27m
deployment.apps/my-prometheus-kube-state-metrics       1/1     1            1           27m
deployment.apps/my-prometheus-server                   1/1     1            1           27m

NAME                                                              DESIRED   CURRENT   READY   AGE
replicaset.apps/my-prometheus-prometheus-pushgateway-86d6f795cb   1         1         1       27m
replicaset.apps/my-prometheus-kube-state-metrics-6c4b65c7b9       1         1         1       27m
replicaset.apps/my-prometheus-server-795d8fc685                   1         1         1       27m

NAME                                          READY   AGE
statefulset.apps/my-prometheus-alertmanager   1/1     27m
The Helm Chart installation creates the following Kubernetes resources:
- Pods: It hosts the deployed Prometheus Kubernetes application inside the cluster.
- Replica Sets: A collection of instances of the same application inside the Kubernetes cluster. It enhances application reliability.
- Deployments: It is the blueprint for creating the application pods.
- Services: It exposes the pods running inside the Kubernetes cluster. We use it to access the deployed Kubernetes application.
The next step is to access and launch the Prometheus Kubernetes application. You’ll access the application using the Kubernetes services for Prometheus. To get all the Kubernetes Services for Prometheus, run this command:
kubectl get serviceOutput:
NAME                                     TYPE        CLUSTER-IP      EXTERNAL-IP   PORT(S)    AGE
my-prometheus-alertmanager-headless      ClusterIP   None            <none>        9093/TCP   28m
my-prometheus-server                     ClusterIP   10.43.186.10    <none>        80/TCP     28m
my-prometheus-prometheus-pushgateway     ClusterIP   10.43.154.83    <none>        9091/TCP   28m
my-prometheus-alertmanager               ClusterIP   10.43.217.41    <none>        9093/TCP   28m
my-prometheus-kube-state-metrics         ClusterIP   10.43.168.65    <none>        8080/TCP   28m
my-prometheus-prometheus-node-exporter   ClusterIP   10.43.195.241   <none>        9100/TCP   28m
The output has listed the following Kubernetes Services for Prometheus:
prometheus-alertmanagerprometheus-alertmanager-headlessprometheus-kube-state-metricsprometheus-prometheus-node-exporterprometheus-prometheus-pushgatewayprometheus-server
We’ll use the prometheus-server Kubernetes service to access the Prometheus application. The prometheus-server is a ClusterIPtype. You can only access it within the Kubernetes cluster. We need to expose this Kubernetes service to access it outside the Kubernetes cluster. Exposing the prometheus-server Kubernetes service will generate a URL. We can load the URL on our browser and access the running application.
Exposing the prometheus-server Kubernetes Service
To expose the prometheus-server Kubernetes service, run this command:
kubectl expose service prometheus-server --type=NodePort --target-port=9090 --name=prometheus-server-extThis command will convert the ClusterIP type to the NodePort type. It makes the prometheus-server accessible outside the Kubernetes Cluster on port 9090.
Now we have exposed the prometheus-server Kubernetes service. Let’s access the Prometheus application using the following command:
minikube service prometheus-server-extThe command generates the following URL:
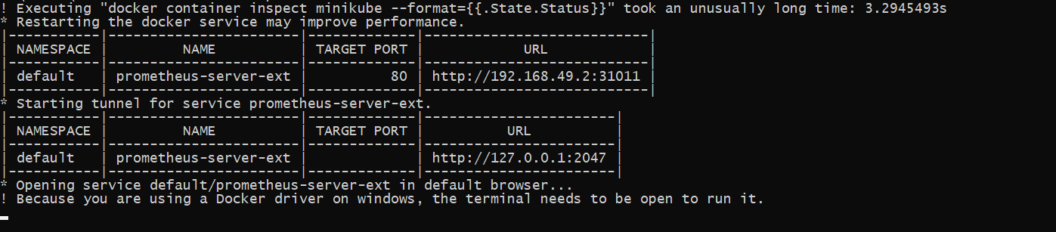
It might take a few moments for the URL to be available. You need to make several retries on your browser until you access the Prometheus Kubernetes application using this URL. You also need to keep the terminal open and the tunnel command running in order to keep accessing the service.
We have installed Prometheus on Kubernetes using Helm. Prometheus is running inside the cluster and we can access it using a browser/URL. For the next steps of the tutorial:
- First, we’ll install Grafana.
- Next, we’ll integrate Prometheus and Grafana. Grafana will use Prometheus as the data source.
- Finally, we’ll use Grafana to create the dashboards for monitoring and observing the Kubernetes cluster.
Install Grafana
To install, we follow the same steps as those for installing Prometheus:
Search for Grafana Helm Charts
To search for the Prometheus Helm charts, run this command:
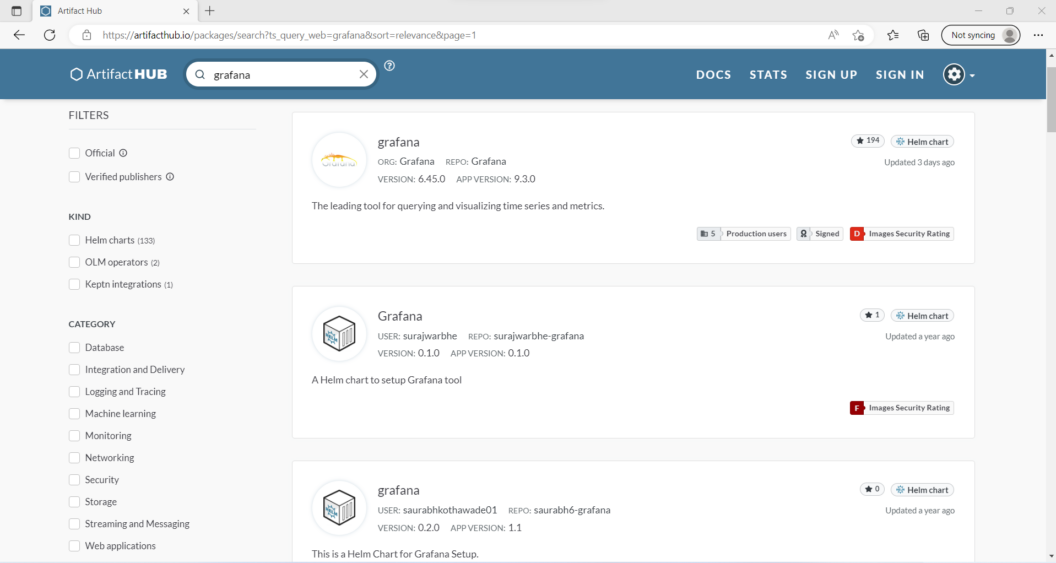
helm search hub grafanaYou can also go to the ArtifactHub repository and search for the official Grafana Helm Chart as shown in the image below:
To get this Grafana Helm chart, run this command:
helm repo add grafana https://grafana.github.io/helm-charts
helm repo update
Output:
"grafana" has been added to your repositories
Hang tight while we grab the latest from your chart repositories...
...Successfully got an update from the "grafana" chart repository
...Successfully got an update from the "prometheus-community" chart repository
...Successfully got an update from the "bitnami" chart repository
Update Complete. ⎈Happy Helming!⎈
Install Grafana Helm Chart on Kubernetes Cluster
You’ll run this helm install command:
helm install grafana grafana/grafanaOutput:
$ helm install my-grafana grafana/grafana \
 --namespace monitoring \
 --set persistence.enabled=true \
 --set persistence.storageClassName="local-storage" \
 --set persistence.existingClaim="grafana-pvc" \
 --set "affinity.nodeAffinity.requiredDuringSchedulingIgnoredDuringExecution.nodeSelectorTerms[0].matchExpressions[0].key=run" \
 --set "affinity.nodeAffinity.requiredDuringSchedulingIgnoredDuringExecution.nodeSelectorTerms[0].matchExpressions[0].operator=In" \
 --set "affinity.nodeAffinity.requiredDuringSchedulingIgnoredDuringExecution.nodeSelectorTerms[0].matchExpressions[0].values[0]=monitoring"
NAME: my-grafana
LAST DEPLOYED: Thu Oct 12 20:13:34 2023
NAMESPACE: monitoring
STATUS: deployed
REVISION: 1
NOTES:
1. Get your 'admin' user password by running:

   kubectl get secret --namespace monitoring my-grafana -o jsonpath="{.data.admin-password}" | base64 --decode ; echo


2. The Grafana server can be accessed via port 80 on the following DNS name from within your cluster:

   my-grafana.monitoring.svc.cluster.local

   Get the Grafana URL to visit by running these commands in the same shell:
     export POD_NAME=$(kubectl get pods --namespace monitoring -l "app.kubernetes.io/name=grafana,app.kubernetes.io/instance=my-grafana" -o jsonpath="{.items[0].metadata.name}")
     kubectl --namespace monitoring port-forward $POD_NAME 3000

3. Login with the password from step 1 and the username: admin
We have installed Grafana on the Kubernetes Cluster. We can access the Grafana server via port 80. The next step is to access and launch the Grafan application. You will access the application using the Kubernetes services for Grafana. To get all the Kubernetes Services for Grafana, run this command:
kubectl get serviceOutput:
NAME                                     TYPE        CLUSTER-IP      EXTERNAL-IP   PORT(S)    AGE
my-prometheus-alertmanager-headless      ClusterIP   None            <none>        9093/TCP   31m
my-prometheus-server                     ClusterIP   10.43.186.10    <none>        80/TCP     31m
my-prometheus-prometheus-pushgateway     ClusterIP   10.43.154.83    <none>        9091/TCP   31m
my-prometheus-alertmanager               ClusterIP   10.43.217.41    <none>        9093/TCP   31m
my-prometheus-kube-state-metrics         ClusterIP   10.43.168.65    <none>        8080/TCP   31m
my-prometheus-prometheus-node-exporter   ClusterIP   10.43.195.241   <none>        9100/TCP   31m
my-grafana                               ClusterIP   10.43.171.37    <none>        80/TCP     24m
We’ll use the grafana Kubernetes service to access the Grafana application. The grafana Kubernetes service is also a ClusterIP type. You can only access it from within the Kubernetes cluster. We need to expose this Kubernetes service to access it outside the Kubernetes cluster.
Exposing the grafana Kubernetes Service
To expose the grafana Kubernetes service, run this command:
kubectl expose service grafana --type=NodePort --target-port=3000 --name=grafana-extThis command will convert the ClusterIP type to the NodePort type. It makes the grafana accessible outside the Kubernetes Cluster on port 3000. Now we have exposed the grafana Kubernetes service. Let’s access the Grafana application using the following command:
minikube service grafana-extThe command generates the following URL:
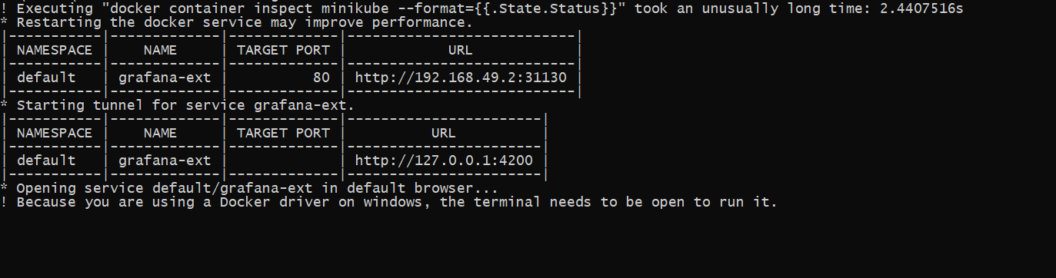
It might take a few moments for the URL to be available. You need to make several retries on your browser until you access the Grafana Kubernetes application using this URL. You also need to keep the terminal open and the tunnel command running in order to keep accessing the service.
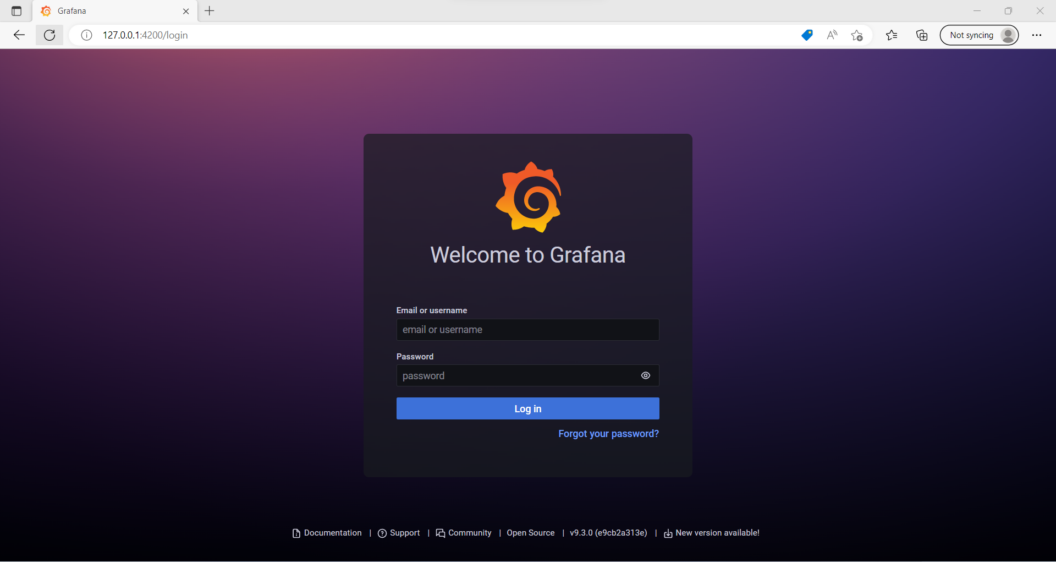
The image above shows the Grafana Login page. To get the password for admin, run this command on a new terminal.
kubectl get secret --namespace default grafana -o jsonpath="{.data.admin-password}" | base64 --decode ; echoNOTE: You need to open a new terminal to run this process to leave the Grafana tunnel running.
Login into Grafana
To login into Grafana, input admin as the user name and your generated password. It will launch a Welcome to Grafana home page as shown below:
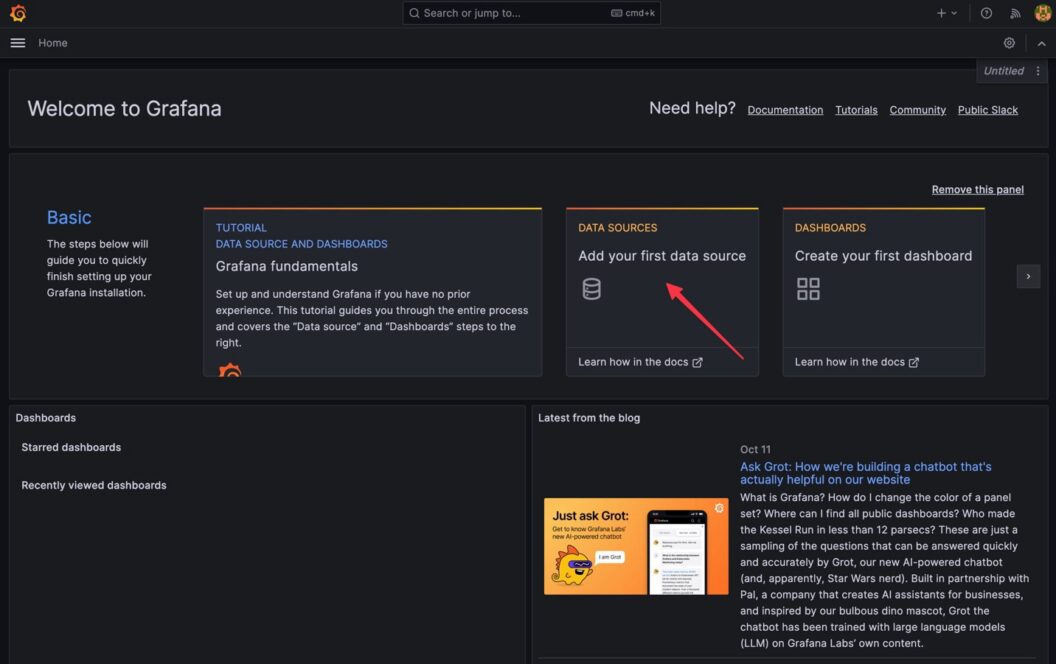
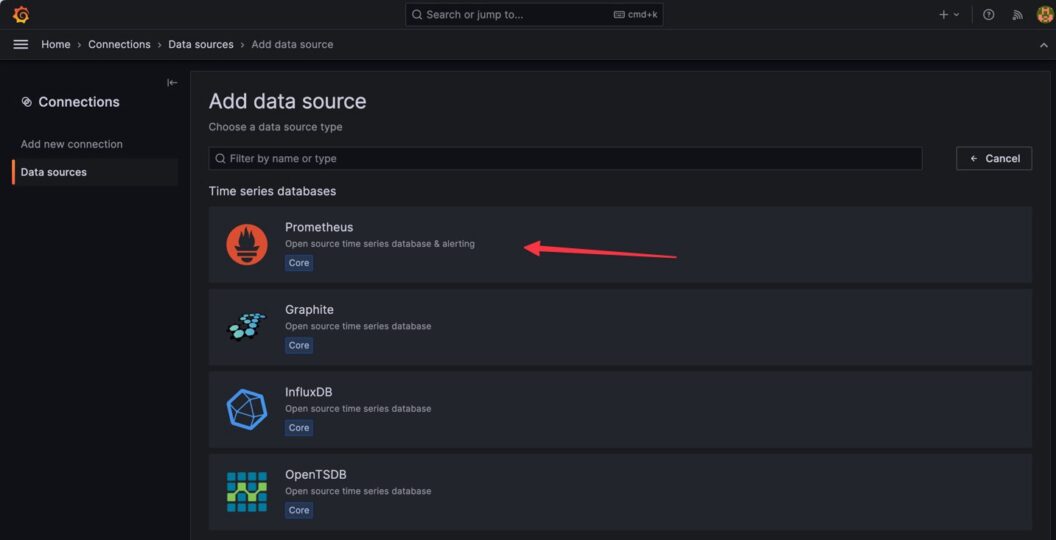
Now it the time to add Prometheus as the data source. To add Prometheus as the data source, follow these steps:
- On the Welcome to Grafana Home page, click
Add your first data source:
- Select
Prometheusas the data source:
- You will then add the URL where your Prometheus application is running. This is the first URL (internal to the cluster) shown when we ran
minikube service prometheus-server-extearlier.
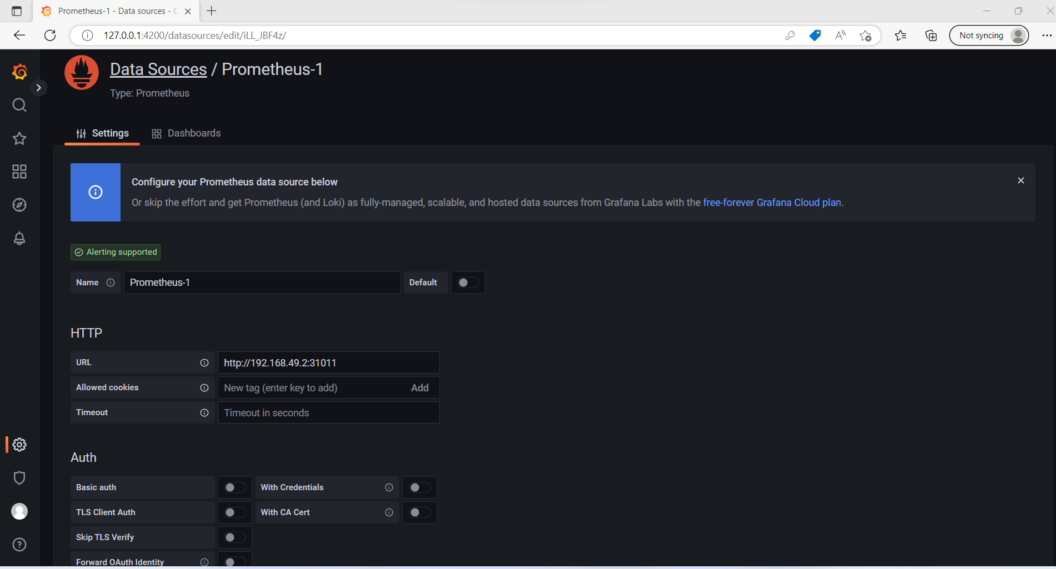
- Click on “Save & test” to save your changes.
You have finished integrating Prometheus and Grafana on Kubernetes with Helm. The last step is to create a Grafana Dashboard. It will help us to visualize our Kubernetes cluster metrics.
Grafana Dashboard
As mentioned earlier, you have the option of creating your dashboards from scratch. You can also import those that Grafana already offers. It this section, we will import a Grafana Dashborad.
To import a Grafana Dashboard, follow these steps:
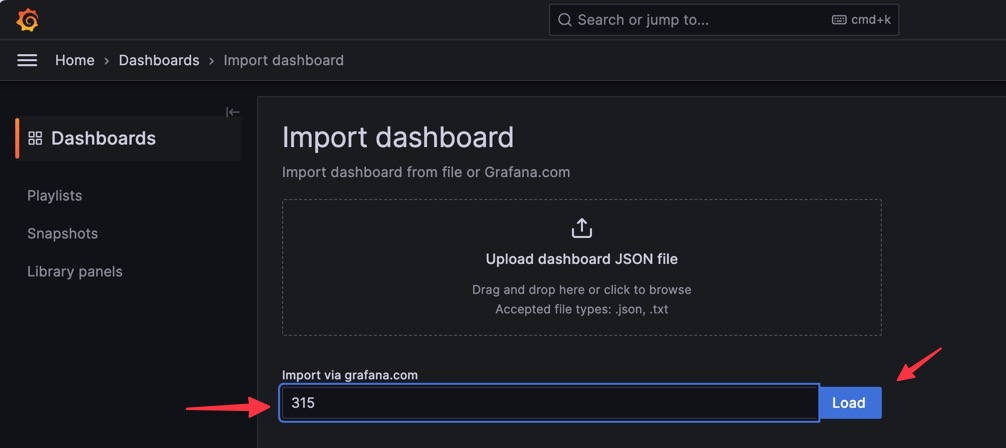
- Get the Grafana Dashboard ID from the Grafana public Dashboard library
- On this web page, search for Kubernetes:
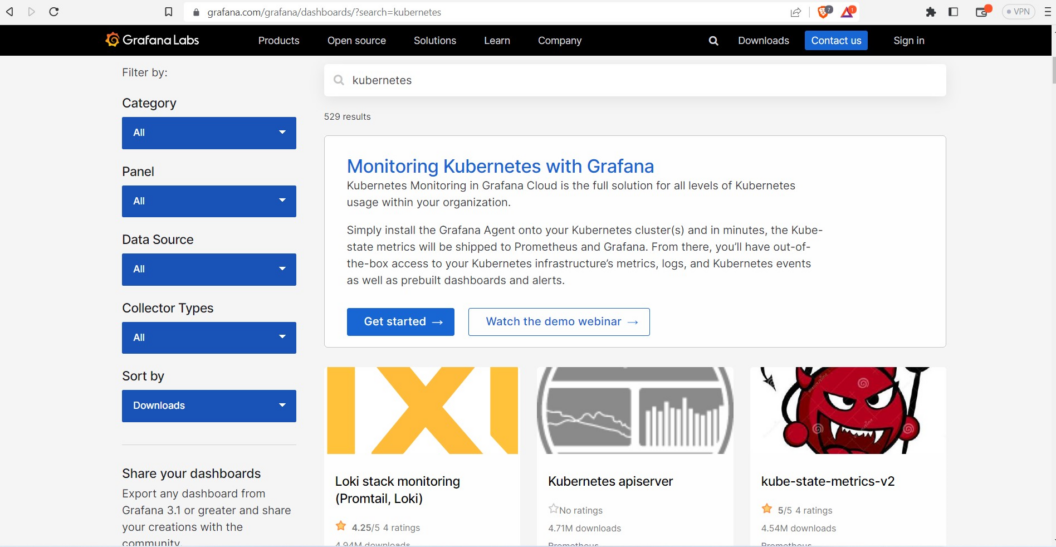
- Scroll until you find the Kubernetes cluster monitoring (via Prometheus) dashboard:
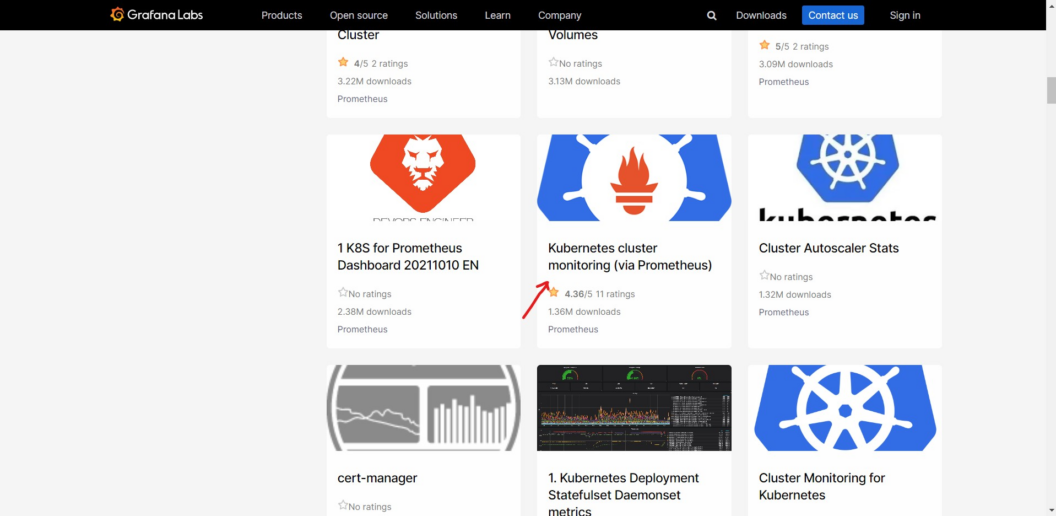
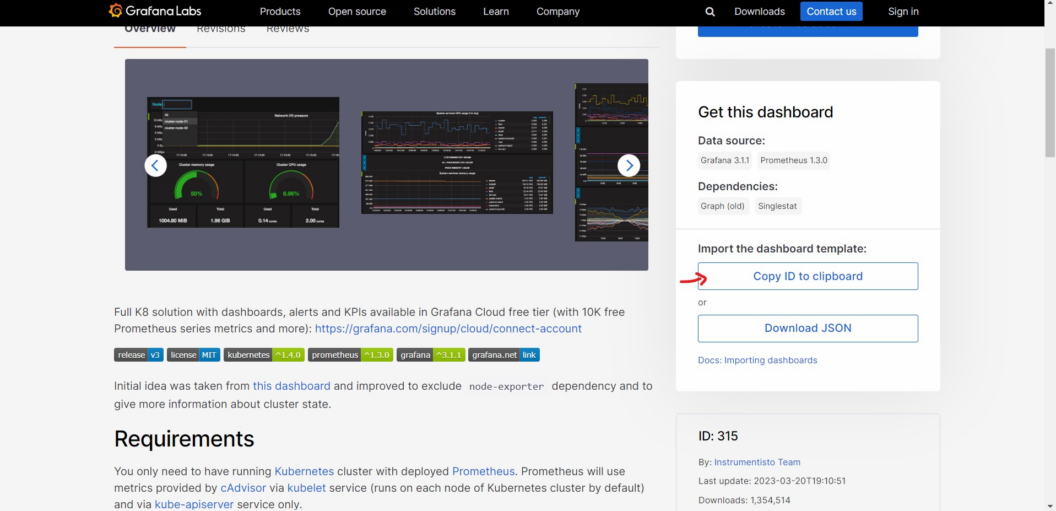
- Select Dashboard and copy the Dashboard ID:
- Go Back to Grafana and click
Homeon the top left corner:
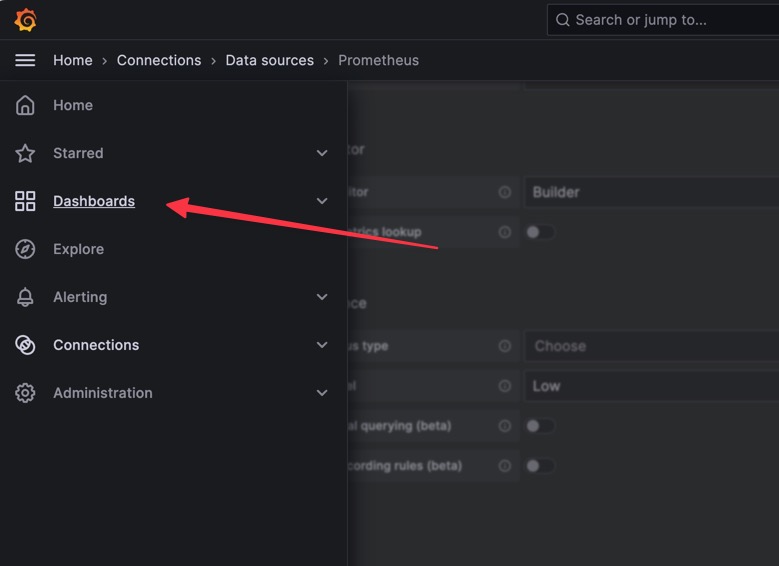
It will dislay a menu.
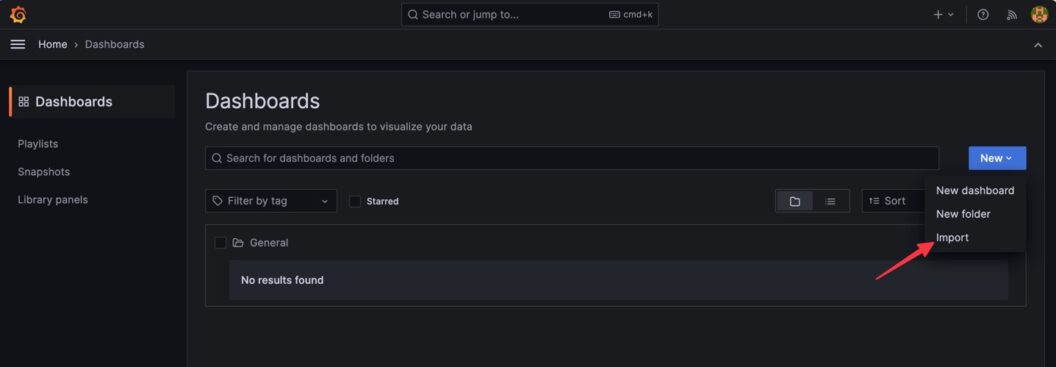
- On the menu, click
Dashboards
- Click
New> Import
- Add the Grafana ID: You will add the Grafana ID that you have copied and click
Load. The Grafana ID is 315.
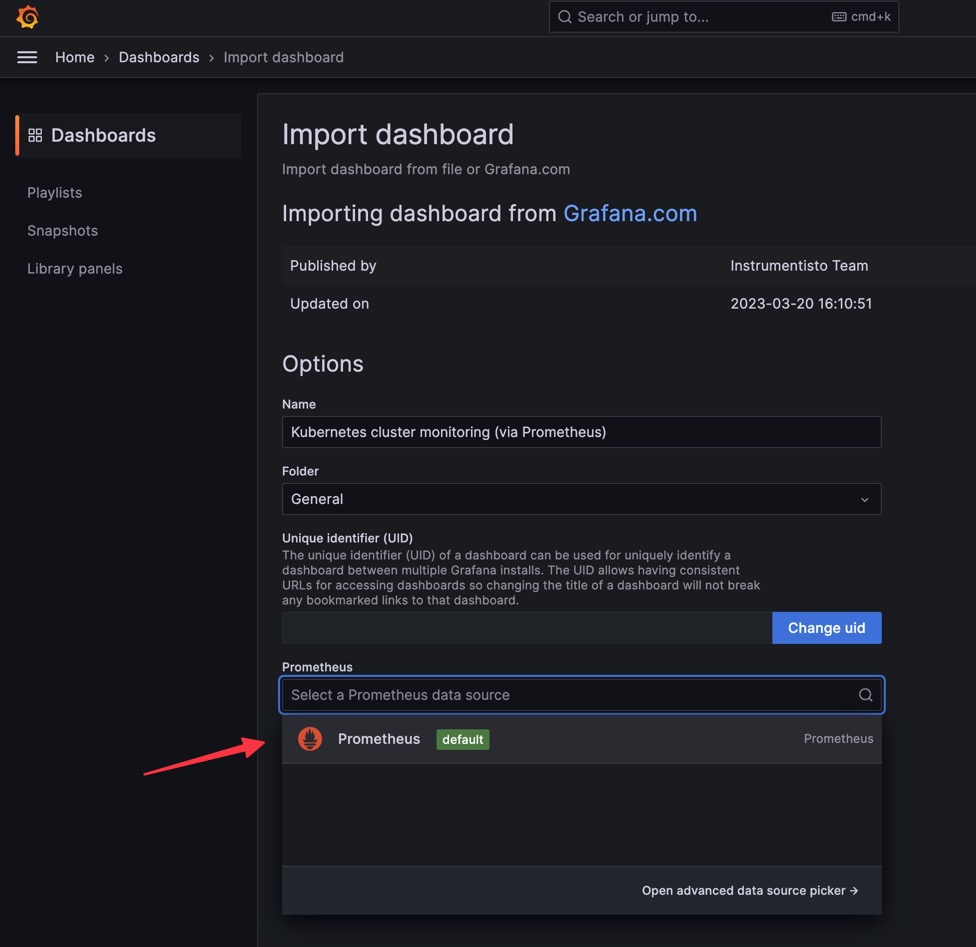
- Select a Promethues Data Source and Click
Import:
It will the launch the Dashboard shown below:
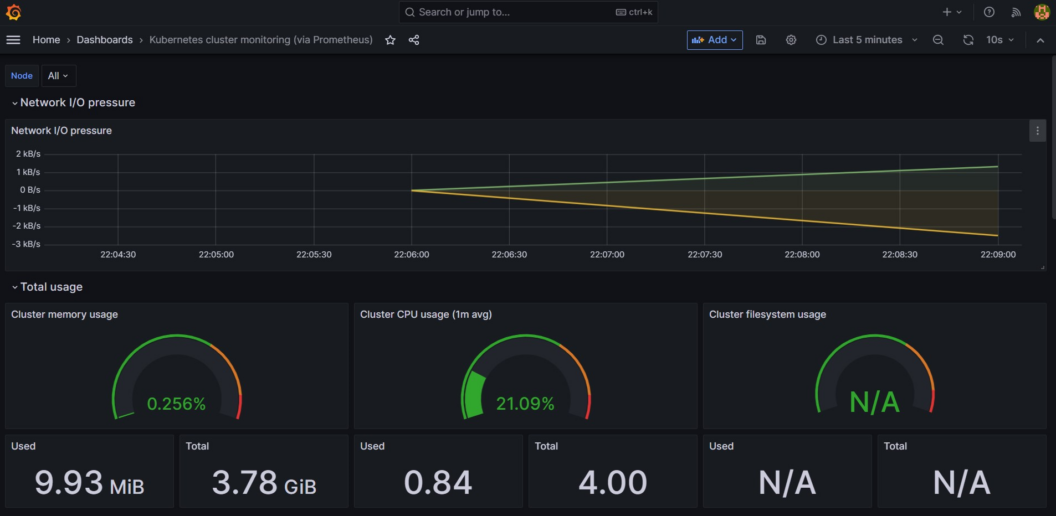
You use this dashboard to monitor and observe the Kubernetes cluster metrics. It displays the following Kubernetes cluster metrics:
- Network I/O pressure.
- Cluster CPU usage.
- Cluster Memory usage.
- Cluster filesystem usage.
- Pods CPU usage.
Additional steps
When deploying Prometheus and Grafana to a production cloud-based cluster like Azure Kubernetes Service (AKS), you need to do the following:
- Create a Persistent Volume for Prometheus
Persistent Volume resources are used to manage durable and permanent storage in a cluster. The administrator provisions a Persistent Volumes to explicitly store data. It could store data:
- On local machine
- On a network share
- Block storage volume provided by a cloud vendor.
Persistent Volume data is persisted regardless of the lifecycle/state of the kubernetes application, pods, application containers or even the kubernetes cluster itself. The folowing example code shows how to create a Persistent Volume to persist application data:
apiVersion: v1
kind: PersistentVolume
metadata:
  name: prometheus-pv
spec:
  capacity:
    storage: 5Gi
  volumeMode: Filesystem
  accessModes:
  - ReadWriteOnce
  persistentVolumeReclaimPolicy: Retain
  storageClassName: local-storage
  local:
    path: /prometheus-data
  nodeAffinity:
    required:
      nodeSelectorTerms:
      - matchExpressions:
        - key: kubernetes.io/hostname
          operator: In
          values:
          - <NODE_PROMETHEUS_RUNS>
You will create a new .yaml file and add the code above. This code will persist your data between service restarts. You can read this blog post to further understand Persistent Volumes.
To add your Persistent Volume to your Cluster, run this command:
kubectl apply -f prometheus-persistent-volume.yaml- Persistent Volume Claim (PVC) for Prometheus
Persistent Volume Claim represents the request for data storage that a pod makes to get the actual block storage. Persistent Volume Claim consume Persistent Volume data resources.
Persistent Volume Claim can request specific data size and access modes. They can be mounted:
- ReadWriteOnce
- ReadOnlyMany
- ReadWriteMany.
The folowing example code shows how to create a Persistent Volume claim to access the Persistent Volume:
apiVersion: v1
kind: PersistentVolumeClaim
metadata:
  name: prometheus-pvc
spec:
  storageClassName: local-storage
  accessModes:
  - ReadWriteOnce
  resources:
    requests:
      storage: 5Gi
You can read this blog post to further understand Persistent Volume Claims.
To add your Persistent Volume Claim to your Cluster, run this command:
kubectl apply -f prometheus-persistent-volume-claim.yaml - Create Persistent Volume and Persistent Volume Claim (PVC) for Grafana
The following example code will create a Persistent Volume for Grafana:
apiVersion: v1
kind: PersistentVolume
metadata:
  name: grafana-pv
spec:
  capacity:
    storage: 5Gi
  volumeMode: Filesystem
  accessModes:
  - ReadWriteOnce
  persistentVolumeReclaimPolicy: Retain
  storageClassName: local-storage
  local:
    path: /grafana-data

  nodeAffinity:
    required:
      nodeSelectorTerms:
      - matchExpressions:
        - key: kubernetes.io/hostname
          operator: In
          values:
- <NODE_GRAFANA_RUNS>- Add a PersistentVolumeClaim for Grafana
apiVersion: v1
kind: PersistentVolumeClaim
metadata:
  name: grafana-pvc
spec:
  storageClassName: local-storage
  accessModes:
  - ReadWriteOnce
  resources:
    requests:
      storage: 5Gi
- To add your Persistent Volume claim to your Cluster, run this command:
kubectl apply -f grafana-persistent-volume-claim.yaml -f grafana-persistent-volume.yaml- Update Prometheus to use the persistent storage:
helm upgrade prometheus prometheus-community/prometheus \
  --set server.persistentVolume.enabled=true \
  --set server.persistentVolume.storageClass=local-storage \
--set server.persistentVolume.existingClaim=prometheus-pvc - Do the same for Grafana
helm upgrade my-grafana grafana/grafana --set persistence.enabled=true,persistence.storageClassName="local-storage",persistence.existingClaim="grafana-pvc"- Configure Prometheus RBAC Permissions
Before deploying Prometheus and Grafana to production, you’ll configure that RBAC privileges using a ClusterRole. You’ll then use a ClusterRoleBinding object to bind this ClusterRole to a ServiceAccount
Example yaml code for configure Prometheus RBAC Permissions:
apiVersion: v1
kind: ServiceAccount
metadata:
  name: prometheus
---
apiVersion: rbac.authorization.k8s.io/v1beta1
kind: ClusterRole
metadata:
  name: prometheus
rules:
- apiGroups: [""]
  resources:
  - nodes
  - nodes/metrics
  - services
  - endpoints
  - pods
  verbs: ["get", "list", "watch"]
- apiGroups: [""]
  resources:
  - configmaps
  verbs: ["get"]
- apiGroups:
  - networking.k8s.io
  resources:
  - ingresses
  verbs: ["get", "list", "watch"]
- nonResourceURLs: ["/metrics"]
  verbs: ["get"]
---
apiVersion: rbac.authorization.k8s.io/v1beta1
kind: ClusterRoleBinding
metadata:
  name: prometheus
roleRef:
  apiGroup: rbac.authorization.k8s.io
  kind: ClusterRole
  name: prometheus
subjects:
- kind: ServiceAccount
  name: prometheus
  namespace: default
To add your RBAC Permissions to your Cluster, run this command:
kubectl apply -f rbac-permissions.yaml- Create a Prometheus Kubernetes service
Prometheus Kubernetes Service will expose the Prometheus application that is running to allow external access.
Example YAML for creating Prometheus Kubernetes Service:
apiVersion: v1
kind: Service
metadata:
  name: prometheus
  labels:
    app: prometheus
spec:
  ports:
  - name: web
    port: 9090
    targetPort: 80
  selector:
    app.kubernetes.io/name: prometheus
  sessionAffinity: ClientIP
To add your Prometheus service to your Cluster, run this command:
kubectl apply -f prometheus-service.yaml- Create Grafana Kubernetes Service
Prometheus Kubernetes Service will expose the Grafana application that is running to allow external access to the Grafana dashboards.
Example YAML for creating Grafana Kubernetes Service:
apiVersion: v1
kind: Service
metadata:
  name: grafana
  namespace: monitoring
  annotations:
      prometheus.io/scrape: 'true'
      prometheus.io/port:   '3000'
spec:
  selector:
    app: grafana
  type: NodePort
  ports:
    - port: 3000
      targetPort: 80
      nodePort: 32000
To add your Grafana service to your Cluster, run this command:
kubectl apply -f grafana-service.yamlFollowing these additional steps, you should run Prometheus and Grafana in production.
Conclusion
In this guide, you have learned how to integrate Prometheus and Grafana on Kubernetes using Helm. Additionally, you have learned how to create a simple dashboard on Grafana which keeps track of resources and performance metrics on the Kubernetes cluster.
Monitoring is crucial in DevOps. It keeps track of the Kubernetes cluster and microservices performance. You have to implement this practice to have a real-time update of your cluster health. You will always know what is going on with your cluster. That’s it for this Prometheus and Grafana guide. Thanks for reading and happy learning!
