Metrics and observability
Help your
team eliminate bottlenecks
Semaphore streamlines issue detection, addressing error-prone tasks and unpredictable tests that could cause sporadic build failures. This enhanced visibility equips you with the tools to optimize the speed and reliability of your CI workflows.
Test Management
Improve your test reliability and shorten the feedback cycle for your developers through features like Semaphore Test Reports and Flaky Tests Dashboards.
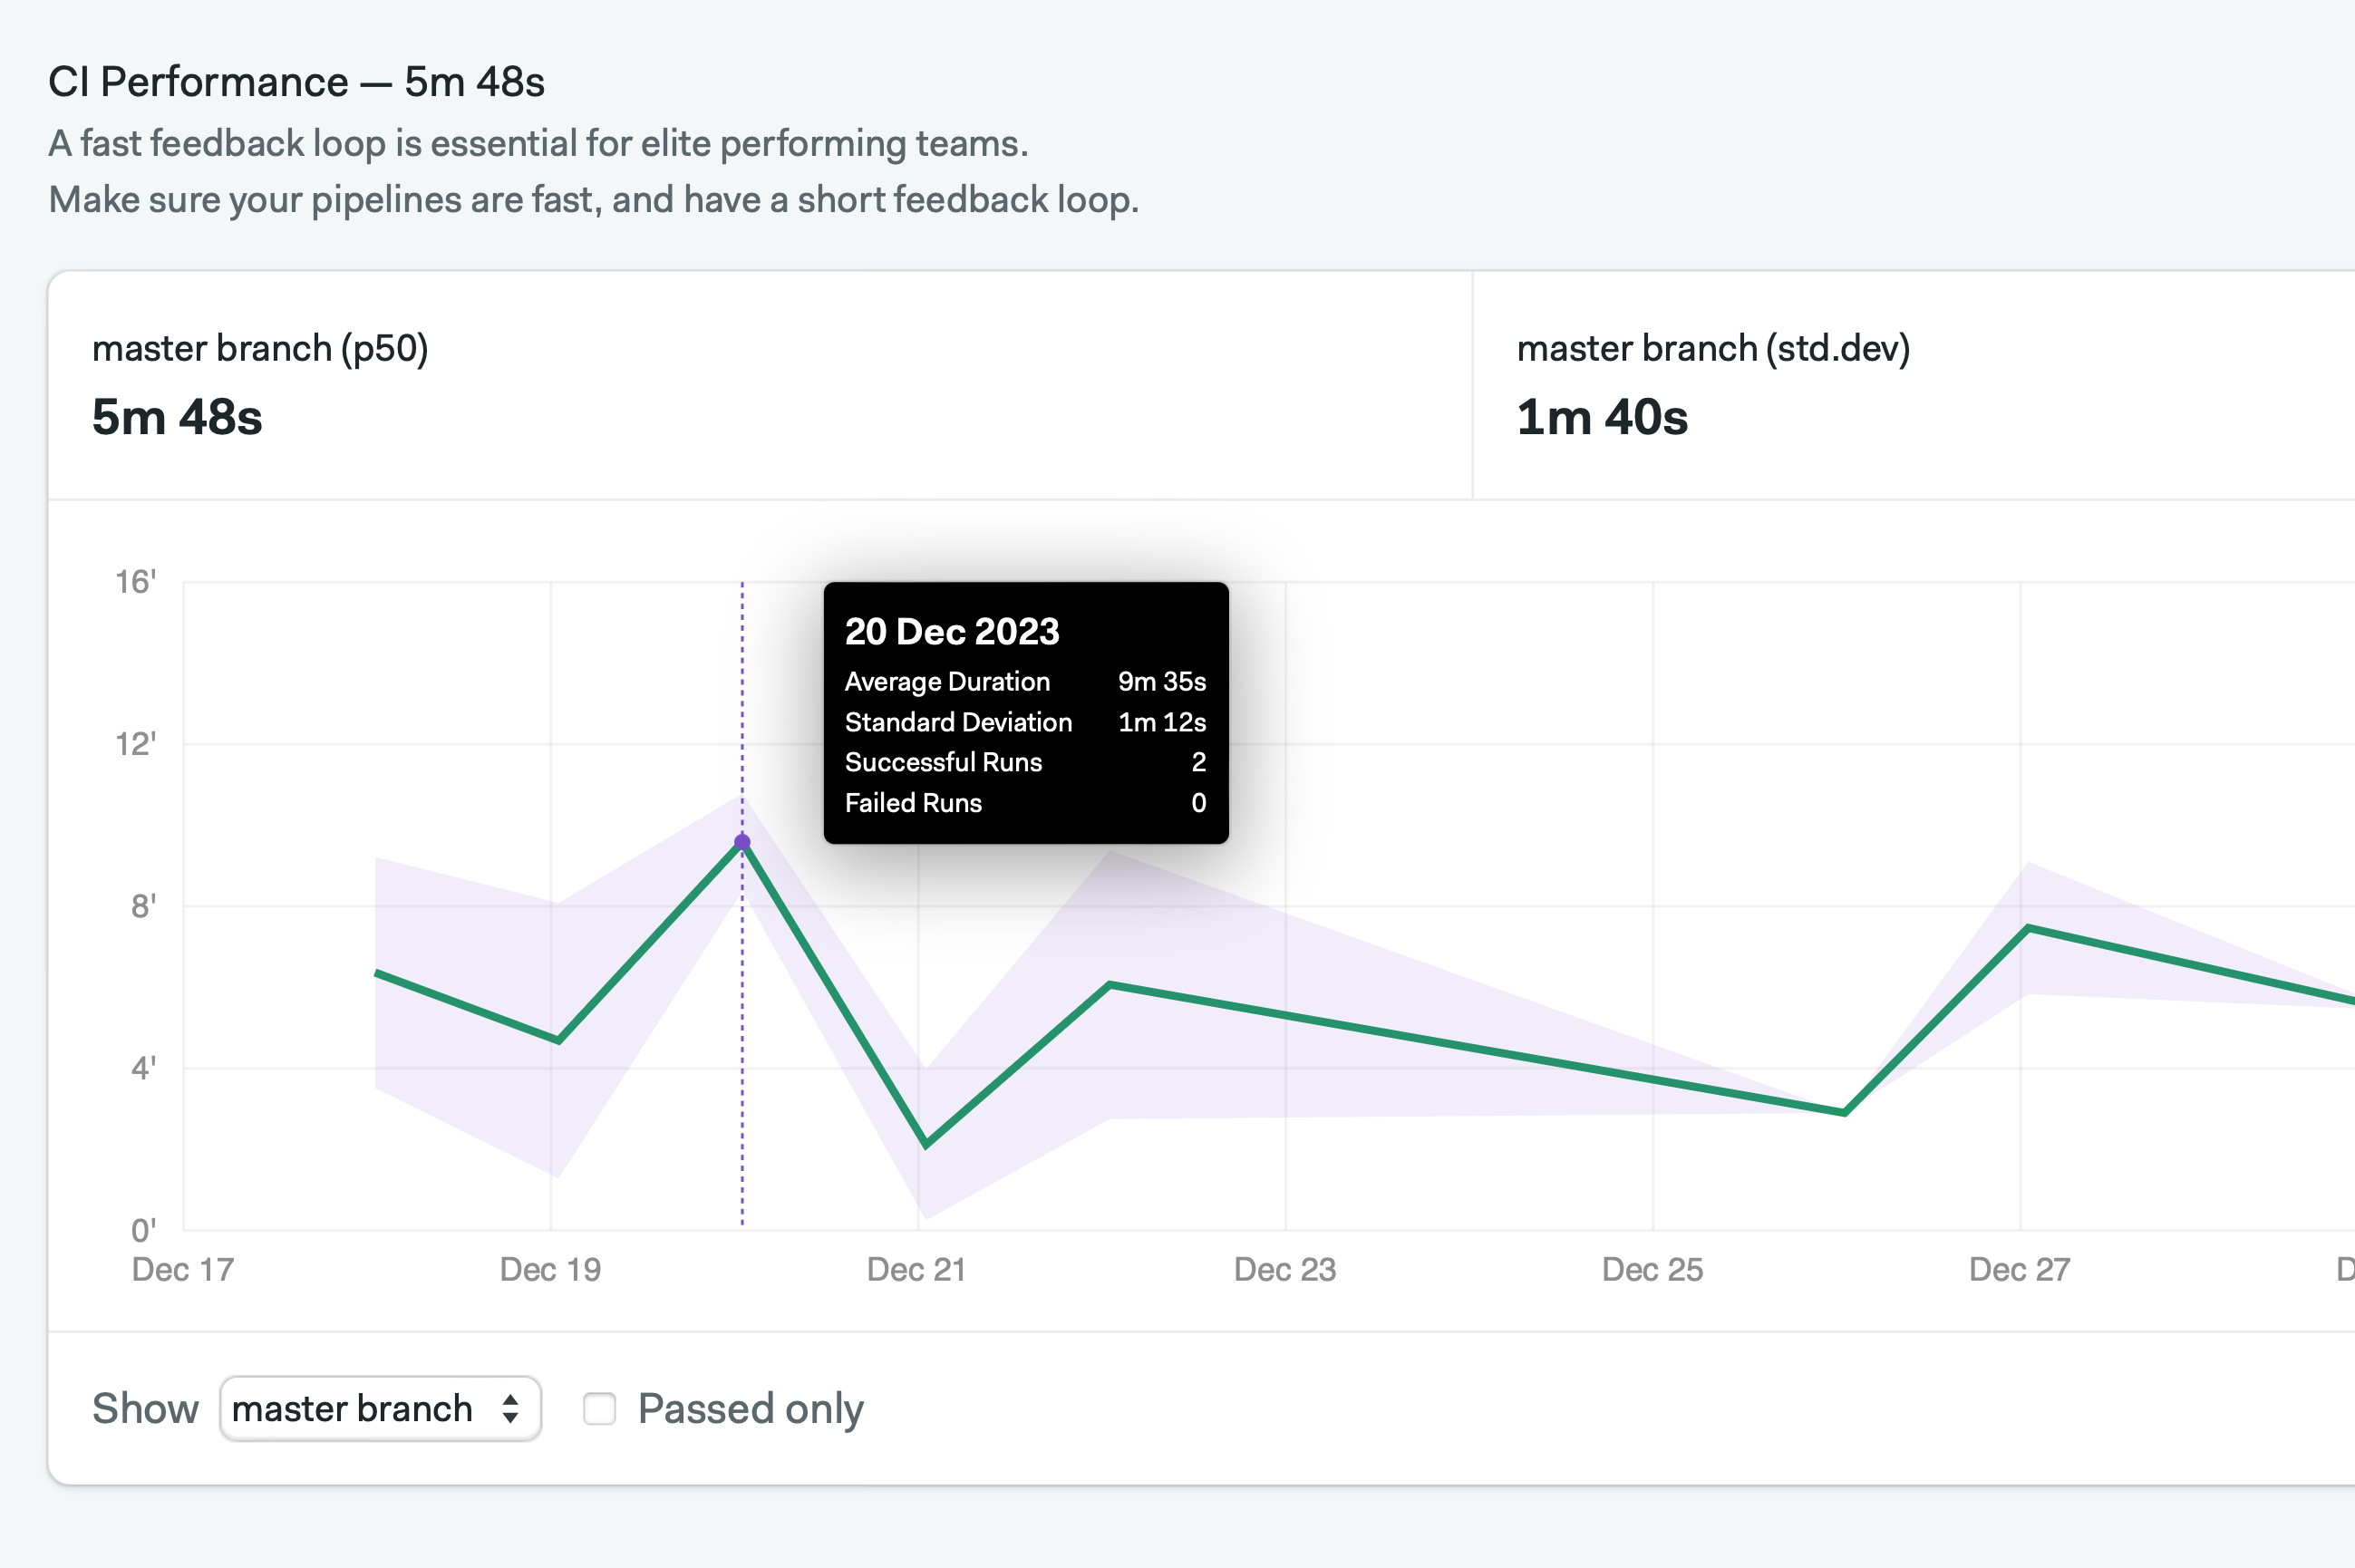
Performance Metrics
Monitor and assess the efficiency, dependability, and regularity of updates in your project pipelines. Quickly pinpoint inefficiencies and potential enhancements.
Project Insights
Keep an eye on all your CI/CD KPIs in a single dashboard. Track DORA metrics for each project and control your usage and spending effectively.
Optimized Feedback Loop
Don’t spend additional resources on external tools. Our set of analytic features provides you with everything you need to keep your feedback loop well-optimized.
Features
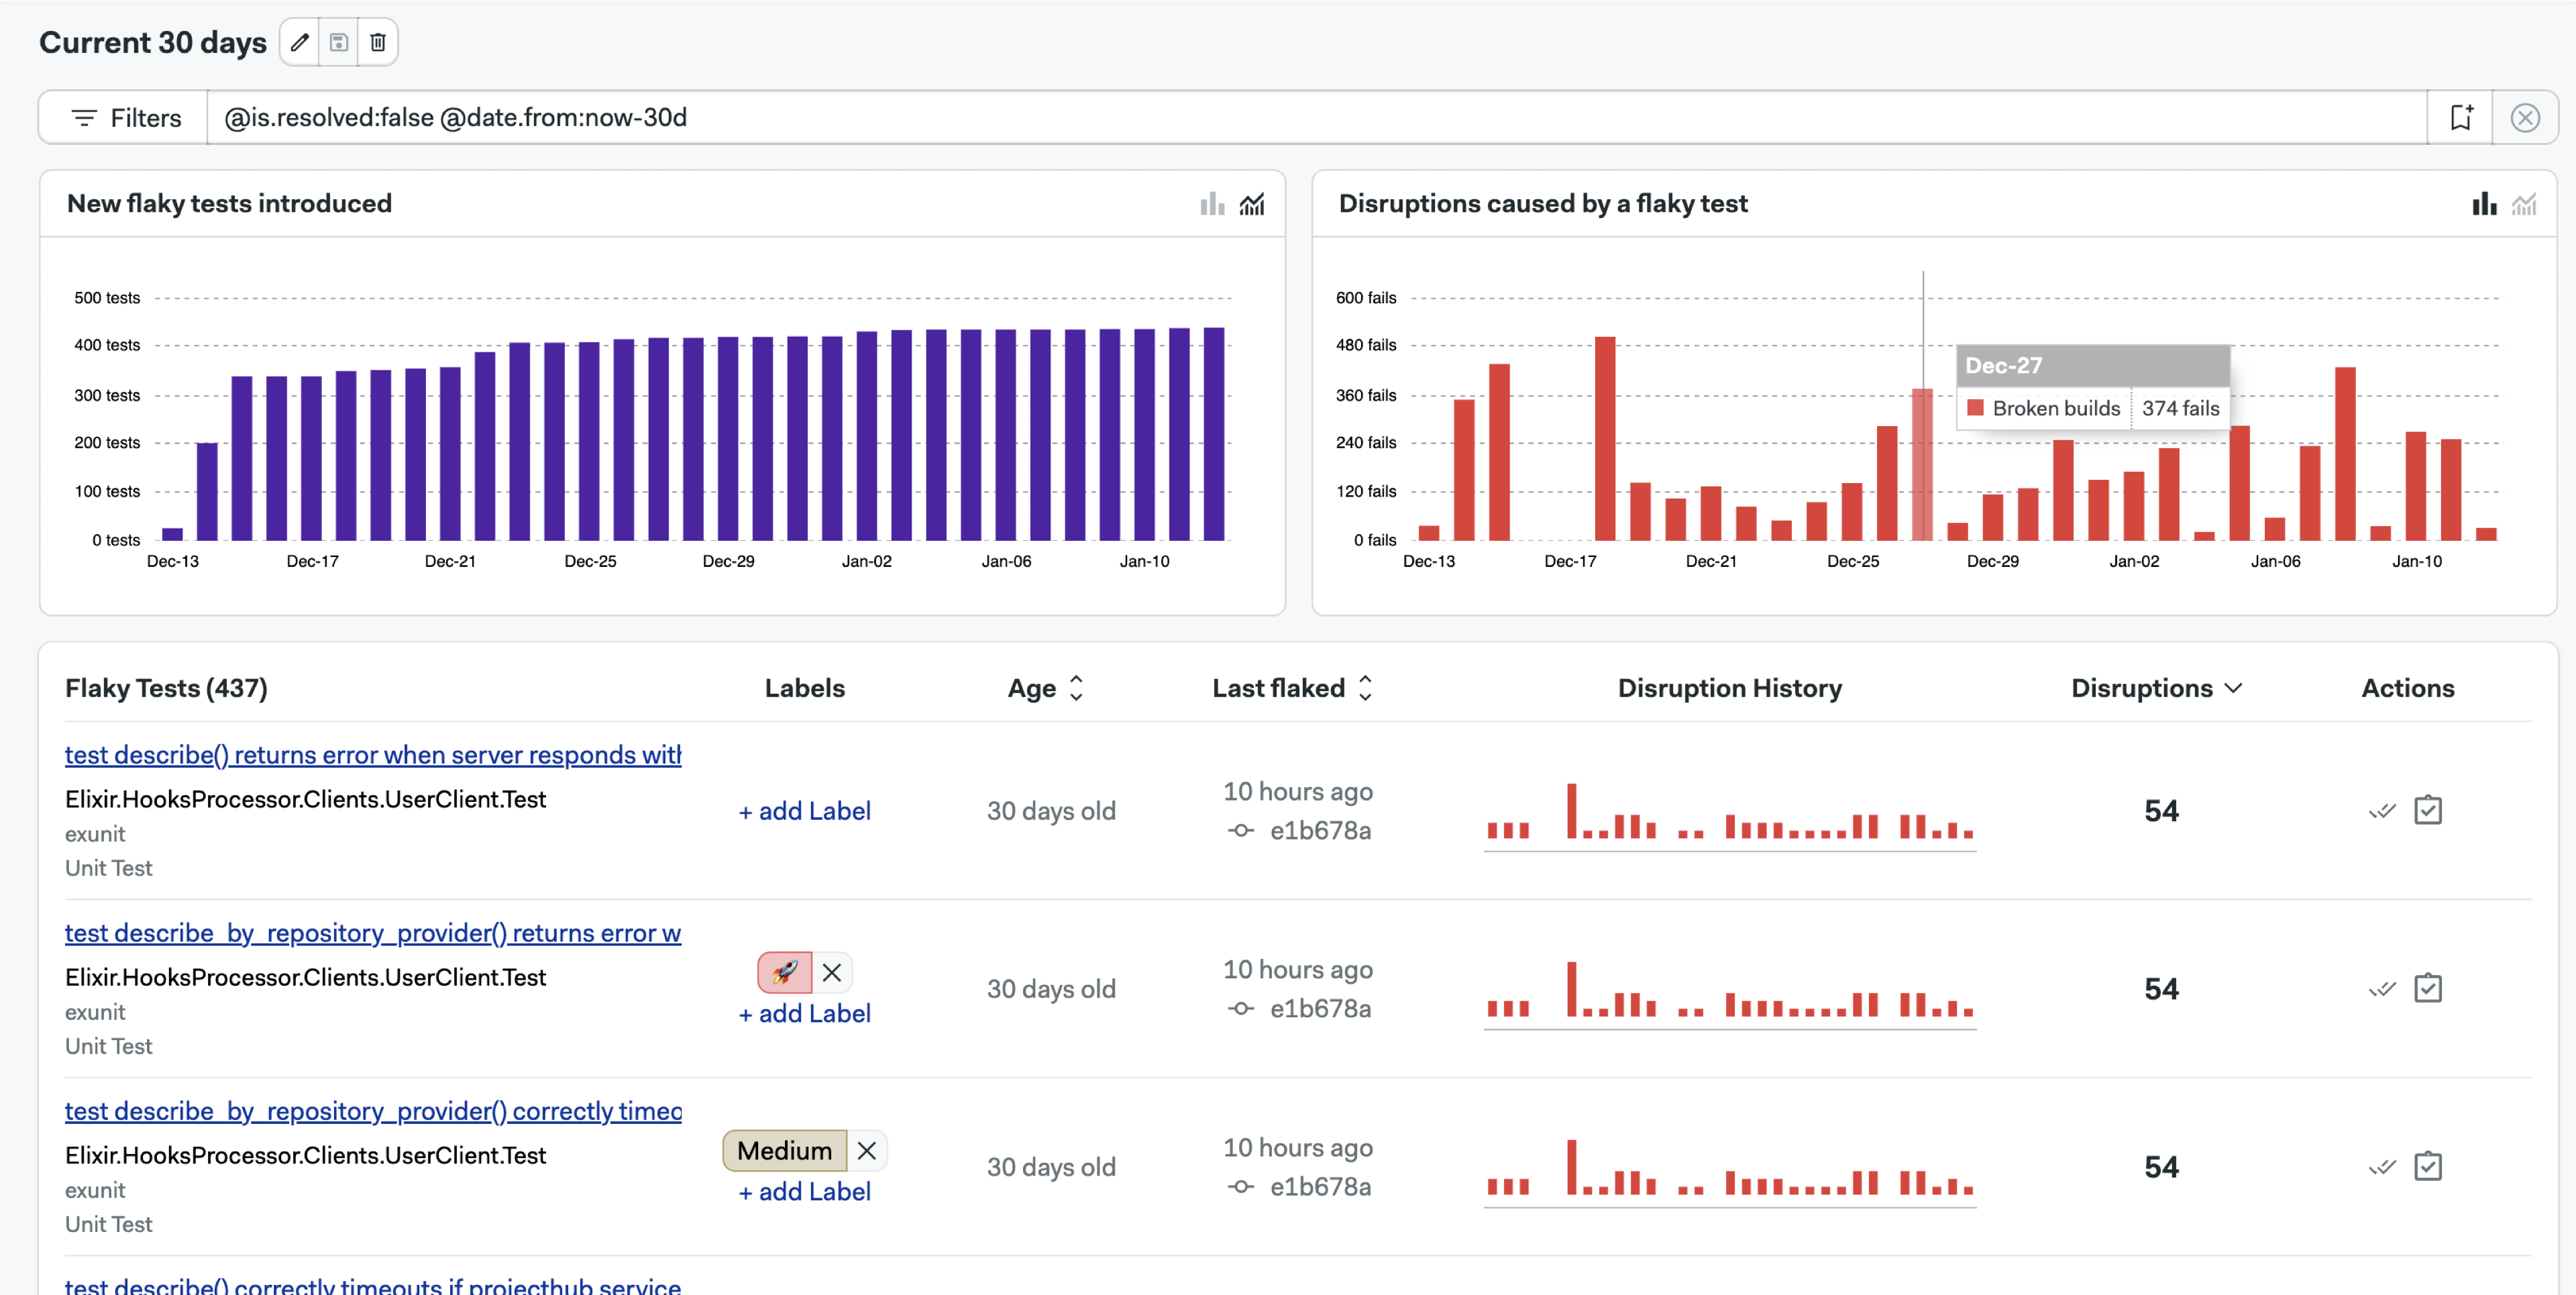
Flaky Tests Dashboard
Detect and manage flaky tests
Flaky tests cause inconsistent builds, wasting time and resources as developers rerun tests to differentiate actual bugs from false alarms. Our dashboard identifies these problematic tests and provides tools for your team to target and resolve the most impactful flakiness efficiently.
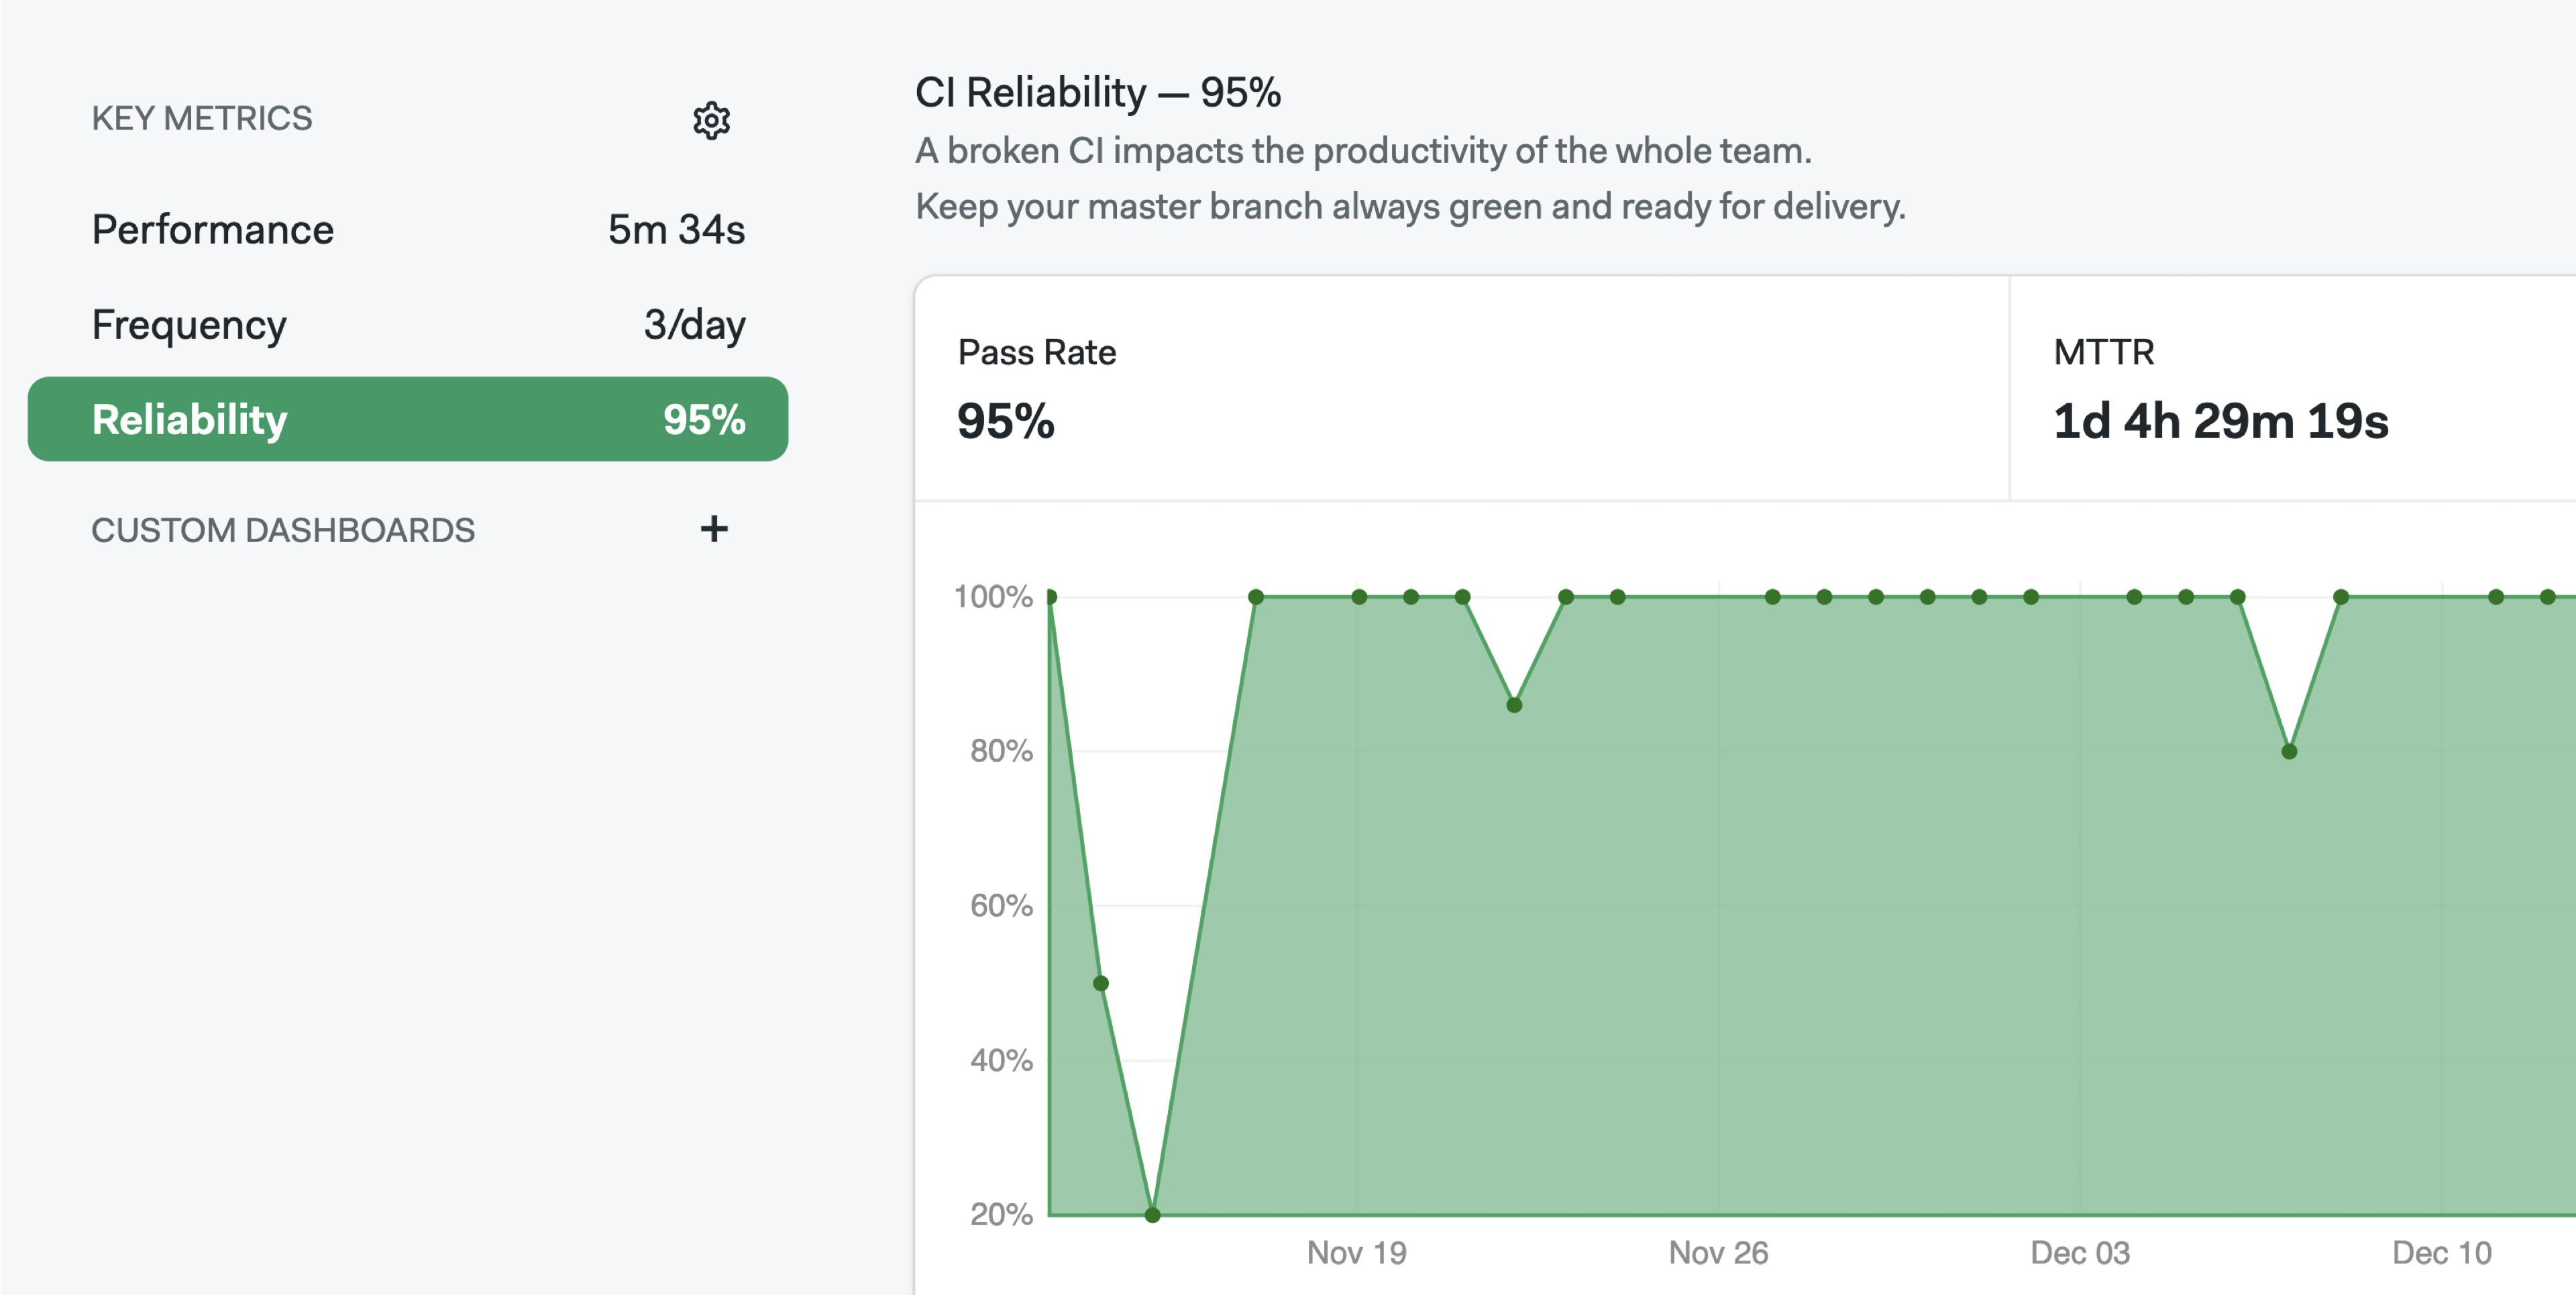
Project Insights
Keep track of key project metrics
Meet Project Insights – your go-to instrument for monitoring your CI/CD reliability, stability, and throughput. With the help of Project Insights, you’ll be able to make smarter decisions and improve your team’s operational performance.
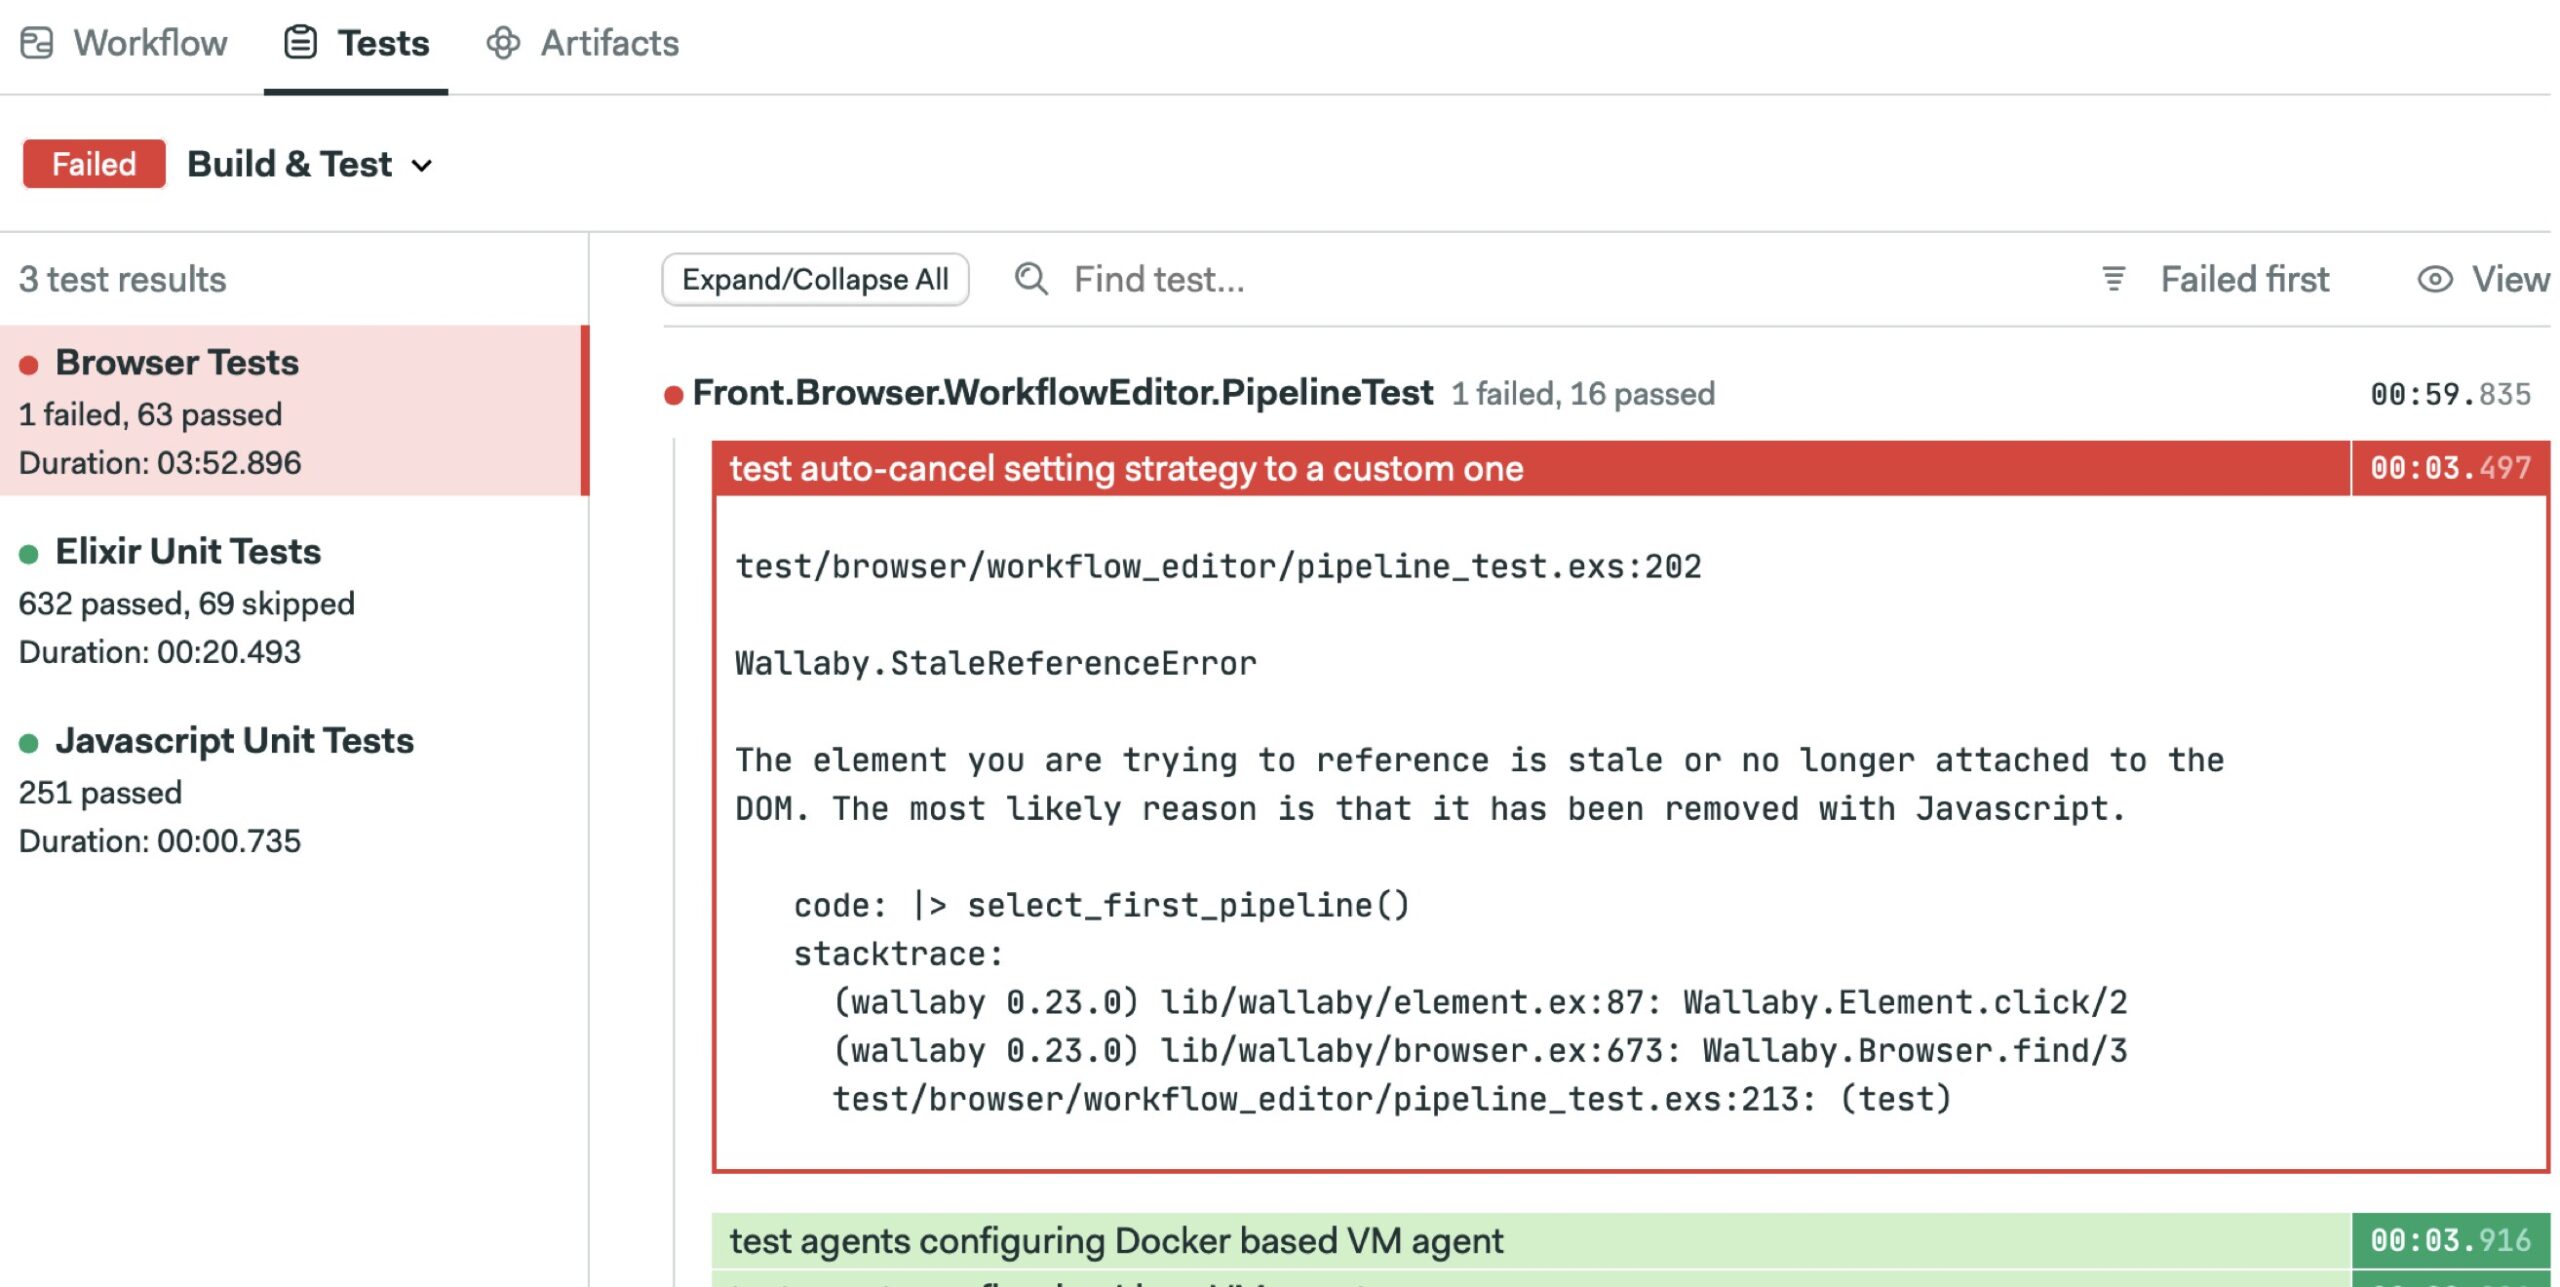
Test Reports
Identify Faulty Tests
Instead of navigating through thousands of log lines, simply dive into a single, unified report for the entire pipeline. In short, the feature merges test reports from all parallel jobs, so users can skim through vital testing data. Take a few minutes to configure Semaphore test reports, and save your team countless hours of scrolling through hard-to-read logs.
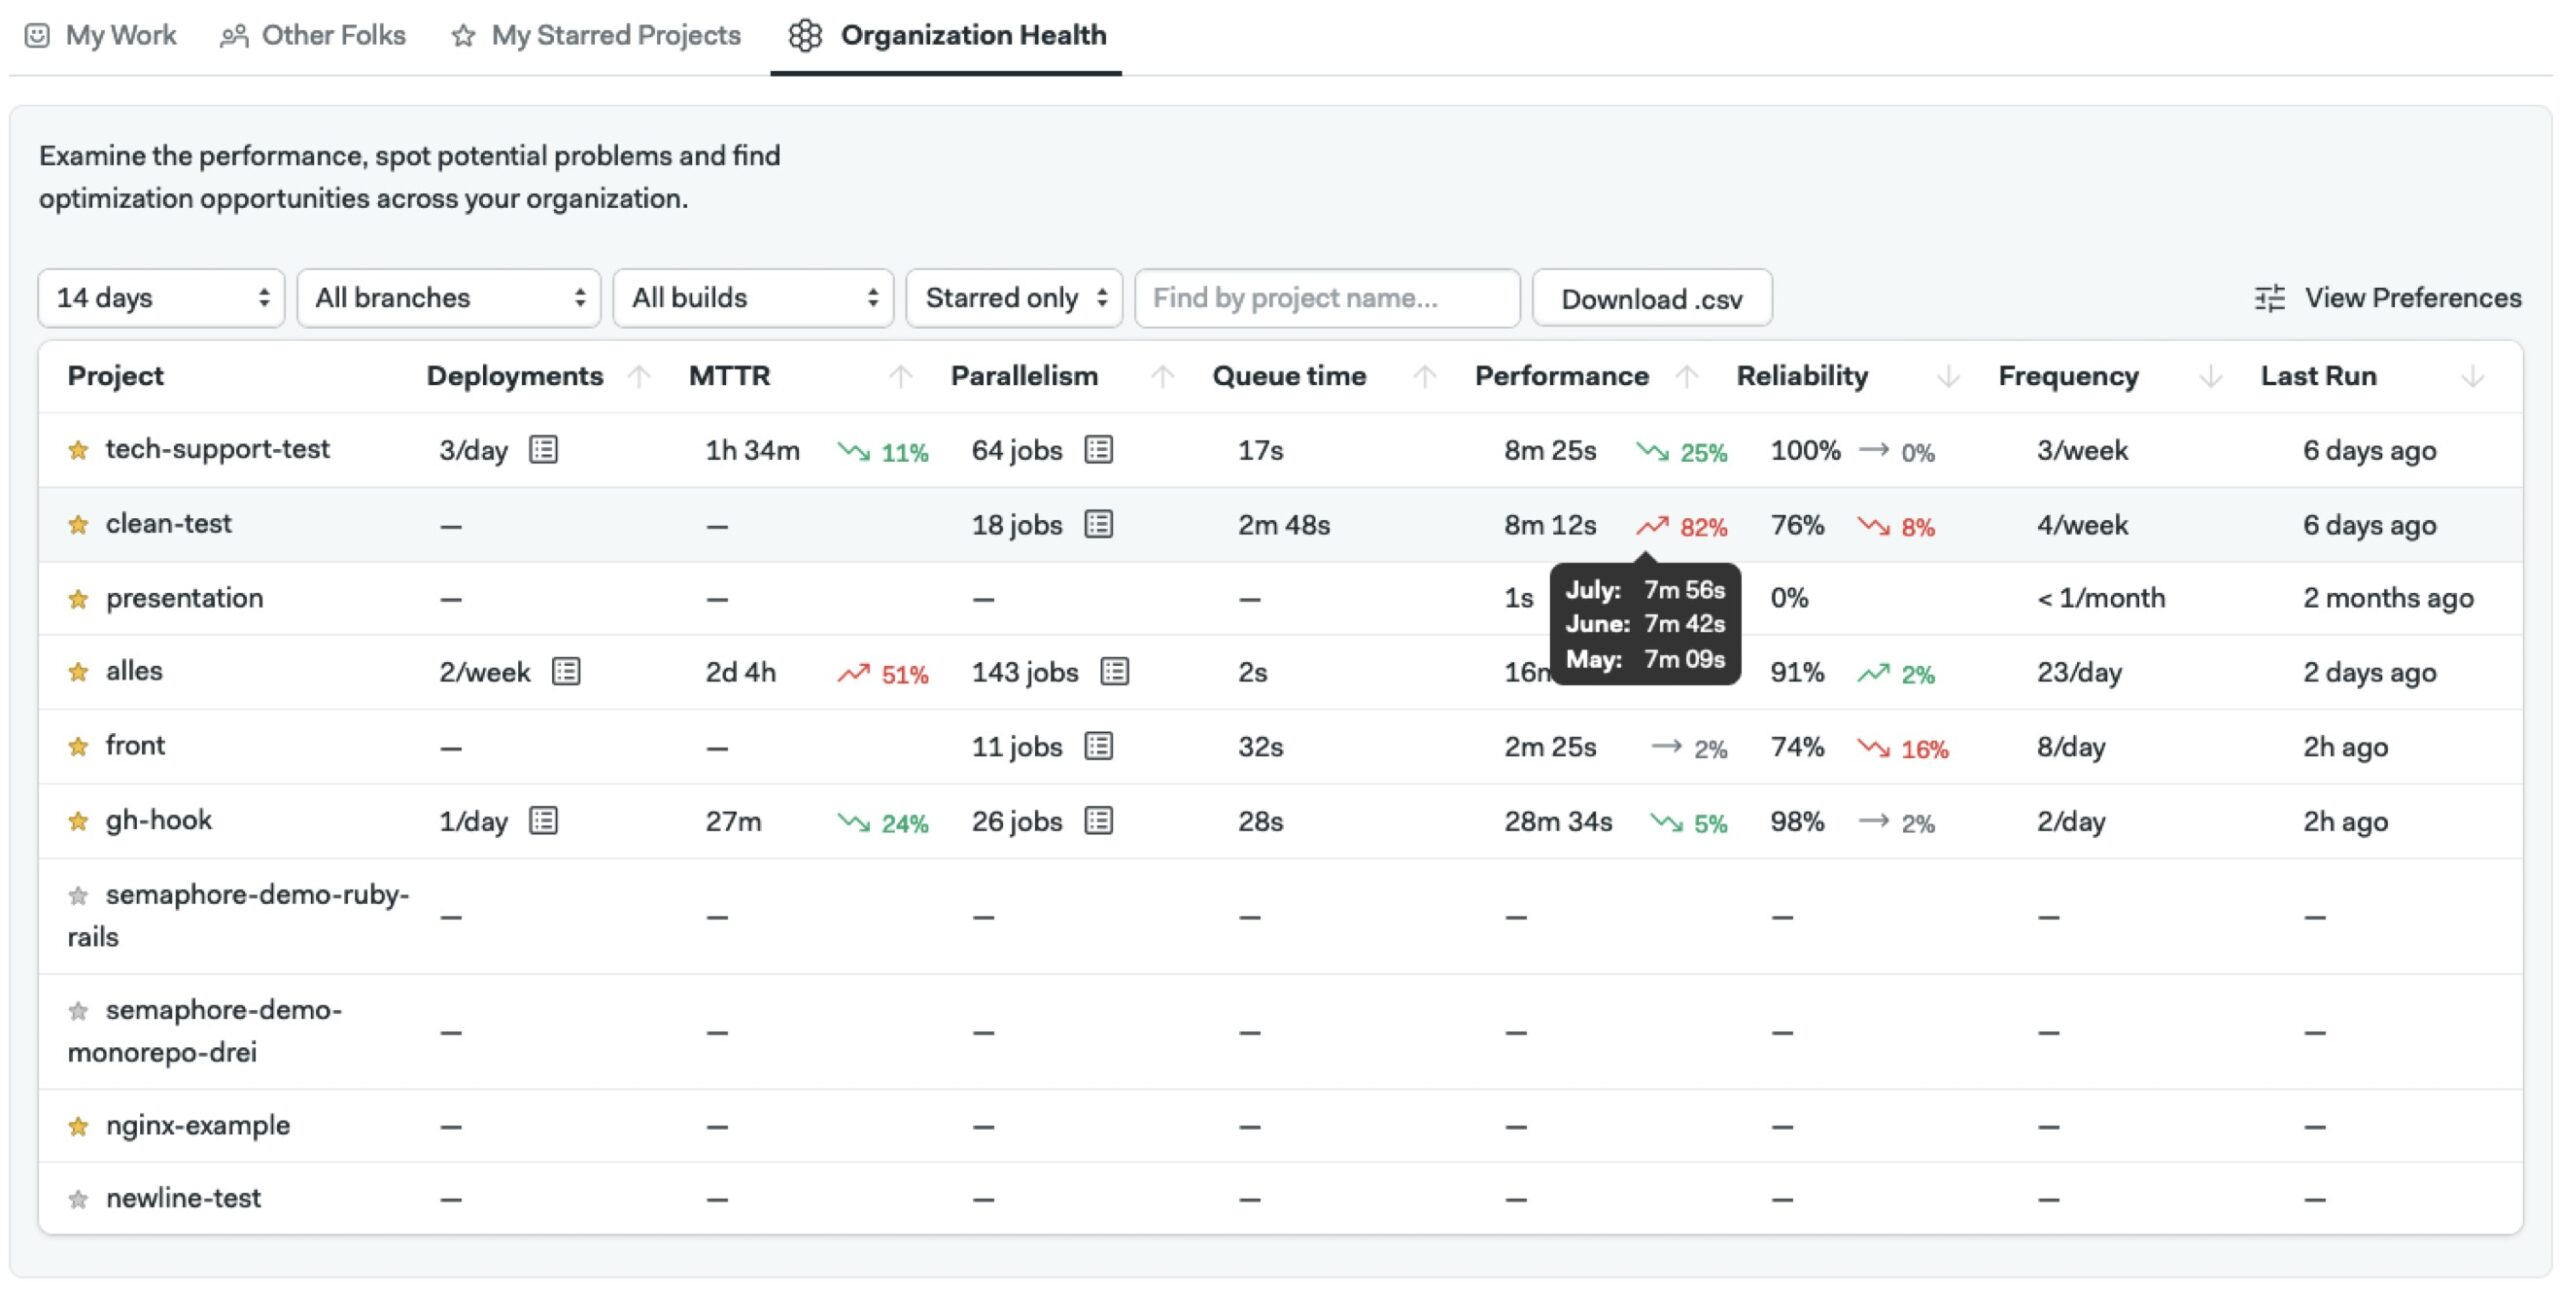
Organization Health
Monitor KPIs across the organization
Get a bird’s eye view into how your organization is doing in terms of CI/CD and operational performance. The Organization Health dashboard allows you to keep track of key performance indicators for all projects across your organization and easily jump into a Project Insights view for a more detailed performance overview.
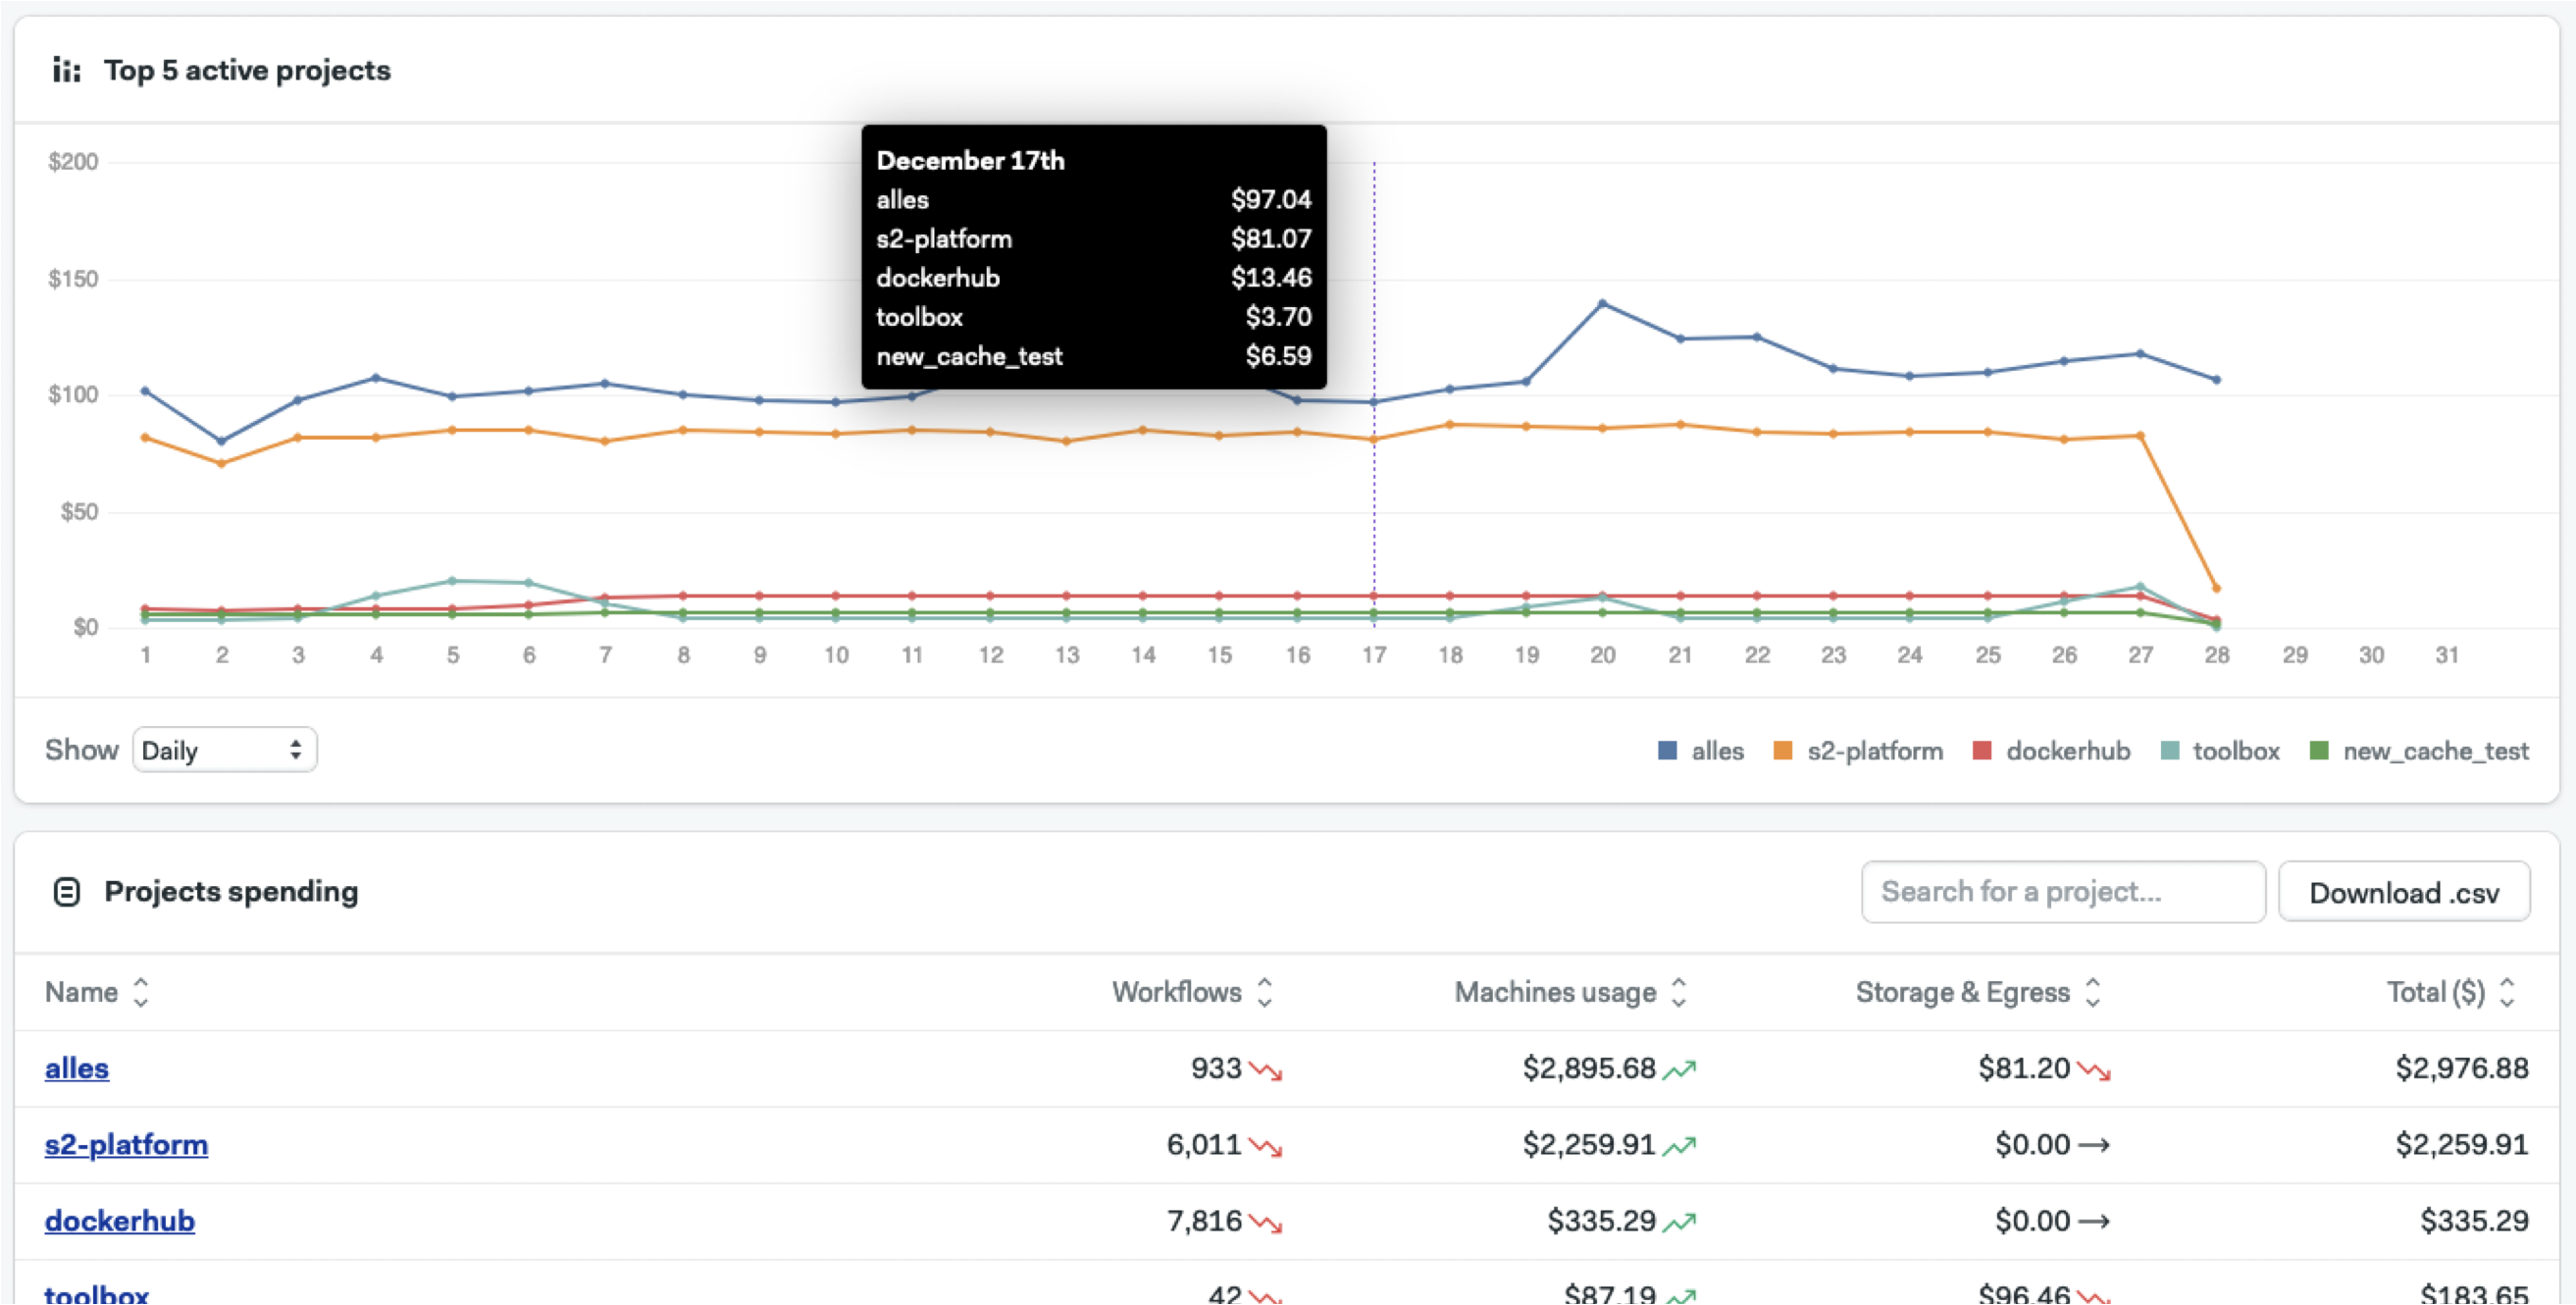
Spending Insights
Optimize your spending
Spending is often an underlooked indicator of your CI/CD efficiency. Gain a clear understanding of your CI/CD expenses with features for tracking spending over time and managing project-specific budgets, aiding in smarter financial decision-making.
All features
Discover all you can do with Semaphore 💪


Let’s get started 🙌
Find out which plan works best for your team 🤑
Discover what Semaphore can do for your team 🧑💻