CI/CD helps you to create a reliable, repeatable process for software development and delivery. But can you actually measure your team’s CI/CD performance and – what’s more important – act upon these metrics?
With Semaphore’s newest feature, the answer is a definite yes. Meet Project Insights – your go-to instrument for monitoring your CI/CD reliability, stability and throughput. With the help of Project Insights, you’ll be able to make smarter decisions and improve your team’s operational performance.
Why did we develop Project Insights?
Engineering leaders, team leads, and developers all care deeply about the performance and stability of CI/CD pipelines.
To help them benchmark against industry standards, the DORA (DevOps Research and Assessment) team, now owned by Google, has identified four key metrics that register the team’s performance and operational health. The metrics are commonly referred to as DORA metrics.
The key metrics are: deployment frequency, lead time for changes, time to restore services, and change failure rate.
To support engineering efforts in tracking and improving these metrics, and hence, improving operational performance, the Semaphore team has developed CI/CD performance metrics – Project Insights – that are available within Semaphore, with no additional installations needed.
Here’s what the new feature entails.
Key metrics in detail
Semaphore breaks down the metrics by Performance, Frequency, and Reliability. You can switch between them from the panel on the left.
On the dashboard, you can see the summary of how long the pipelines need to run on average (Performance), how frequently the builds run (Frequency), and how stable the code is (Reliability).
Let’s take a closer look at each metric.
CI performance metrics
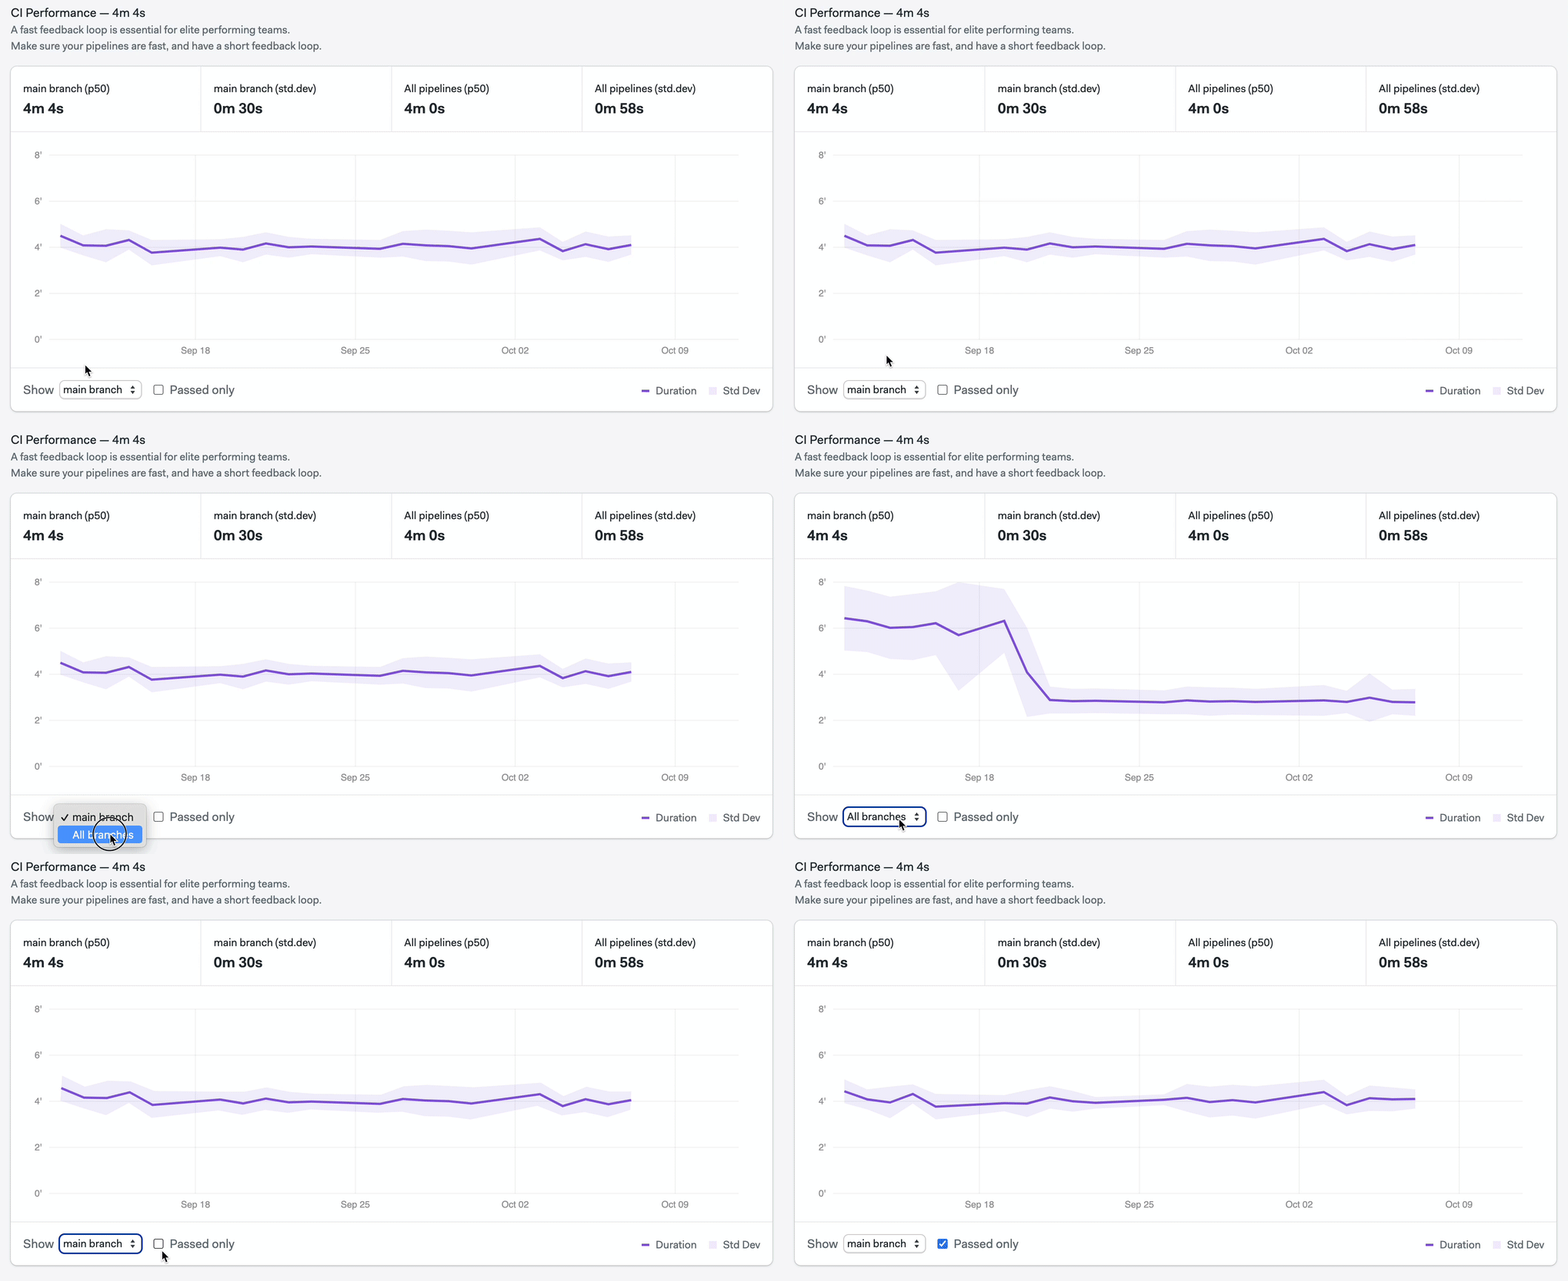
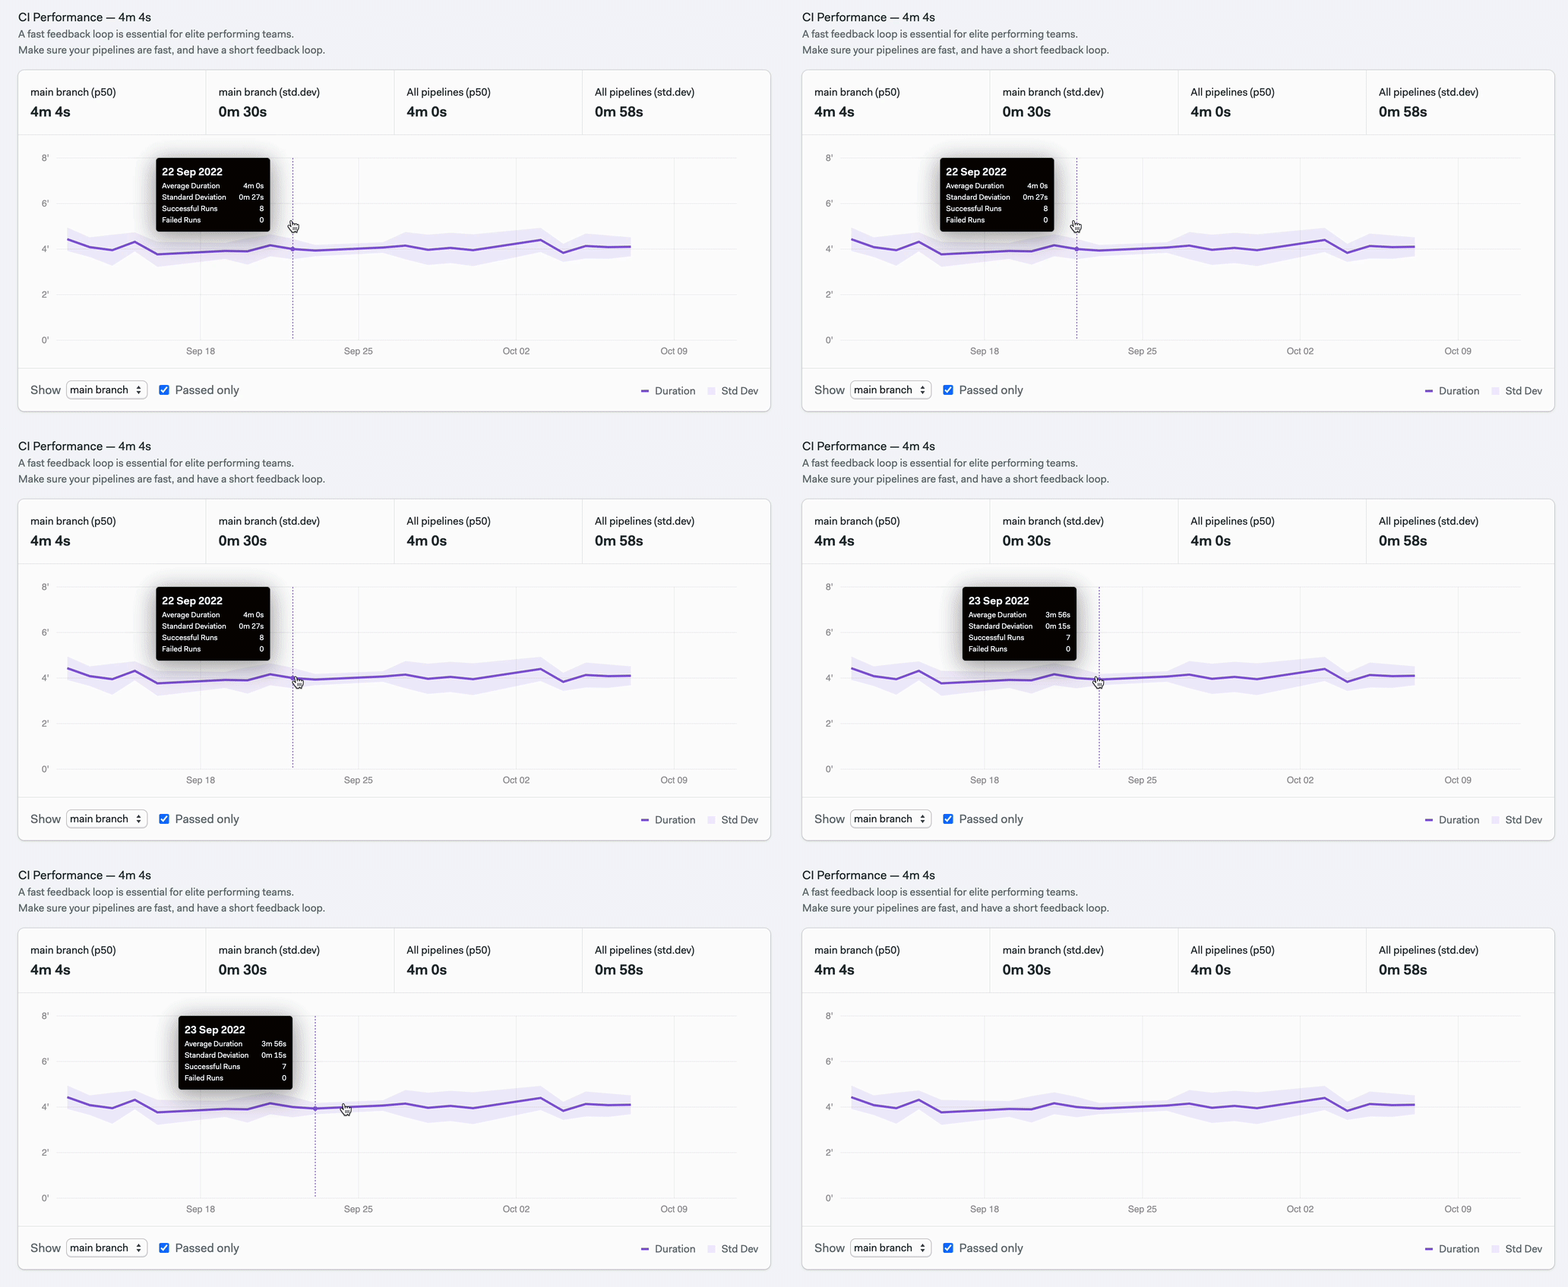
CI performance metrics provide an overview of the median time (p50) and the standard deviation (std.dev) that it takes the pipelines to run. You can see the data for a selected branch (in this case, main) and all pipelines combined.

In this example, the metrics show that at least 50% of workflows on the main branch finished in 10 min 36 sec for the main branch.

If your standard deviation is too high compared to median, it means that there’s a big difference between the slowest and fastest workflows. If the standard deviation number is low, that’s actually a good sign: it means that your workflow execution time is consistent.
On the graph, you can also see the average duration, standard deviation, the number of successful and failed runs for any given day. Simply move the cursor along the timeline.

You can also filter the metrics by master branch or choose to see all branches. You can also check the checkbox to see only passed runs.

Delivering fast is important because it allows your organization to see how impactful your features and bug fixes really are. With CI performance metrics, you stay on top of your organization’s efforts.
CI frequency metrics
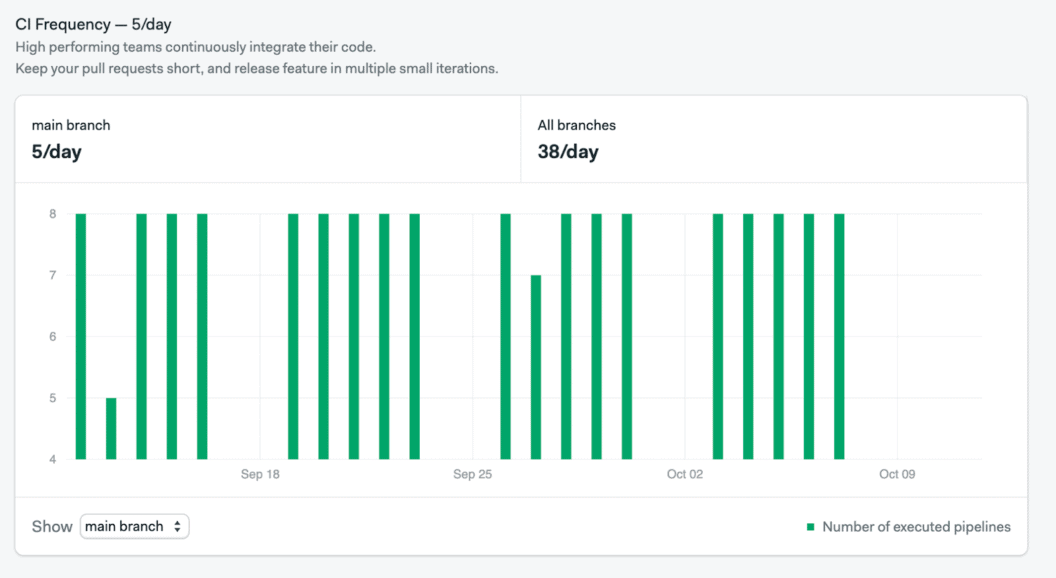
High performing teams continuously integrate new code. It helps organizations to shorten the feedback loop and act fast and adequately on any changes. According to Google’s State of DevOps report, elite performers integrate new code up to several times a day, thousands of times more often than low performers.
To help you see where your team stands in terms of CI frequency, Semaphore now shows the total number of deployments and a breakdown per branch.

The metrics show the number of executed pipelines per week for a selected branch and the total number of runs for all pipelines per day.
CI reliability metrics
How fast pipelines run is not the only indicator of your team’s performance. What’s also important is how stable the code is. Broken CI impacts the productivity of the whole team.
Keep your main branch always green and ready for delivery. Here’s how Semaphore supports you in these efforts.

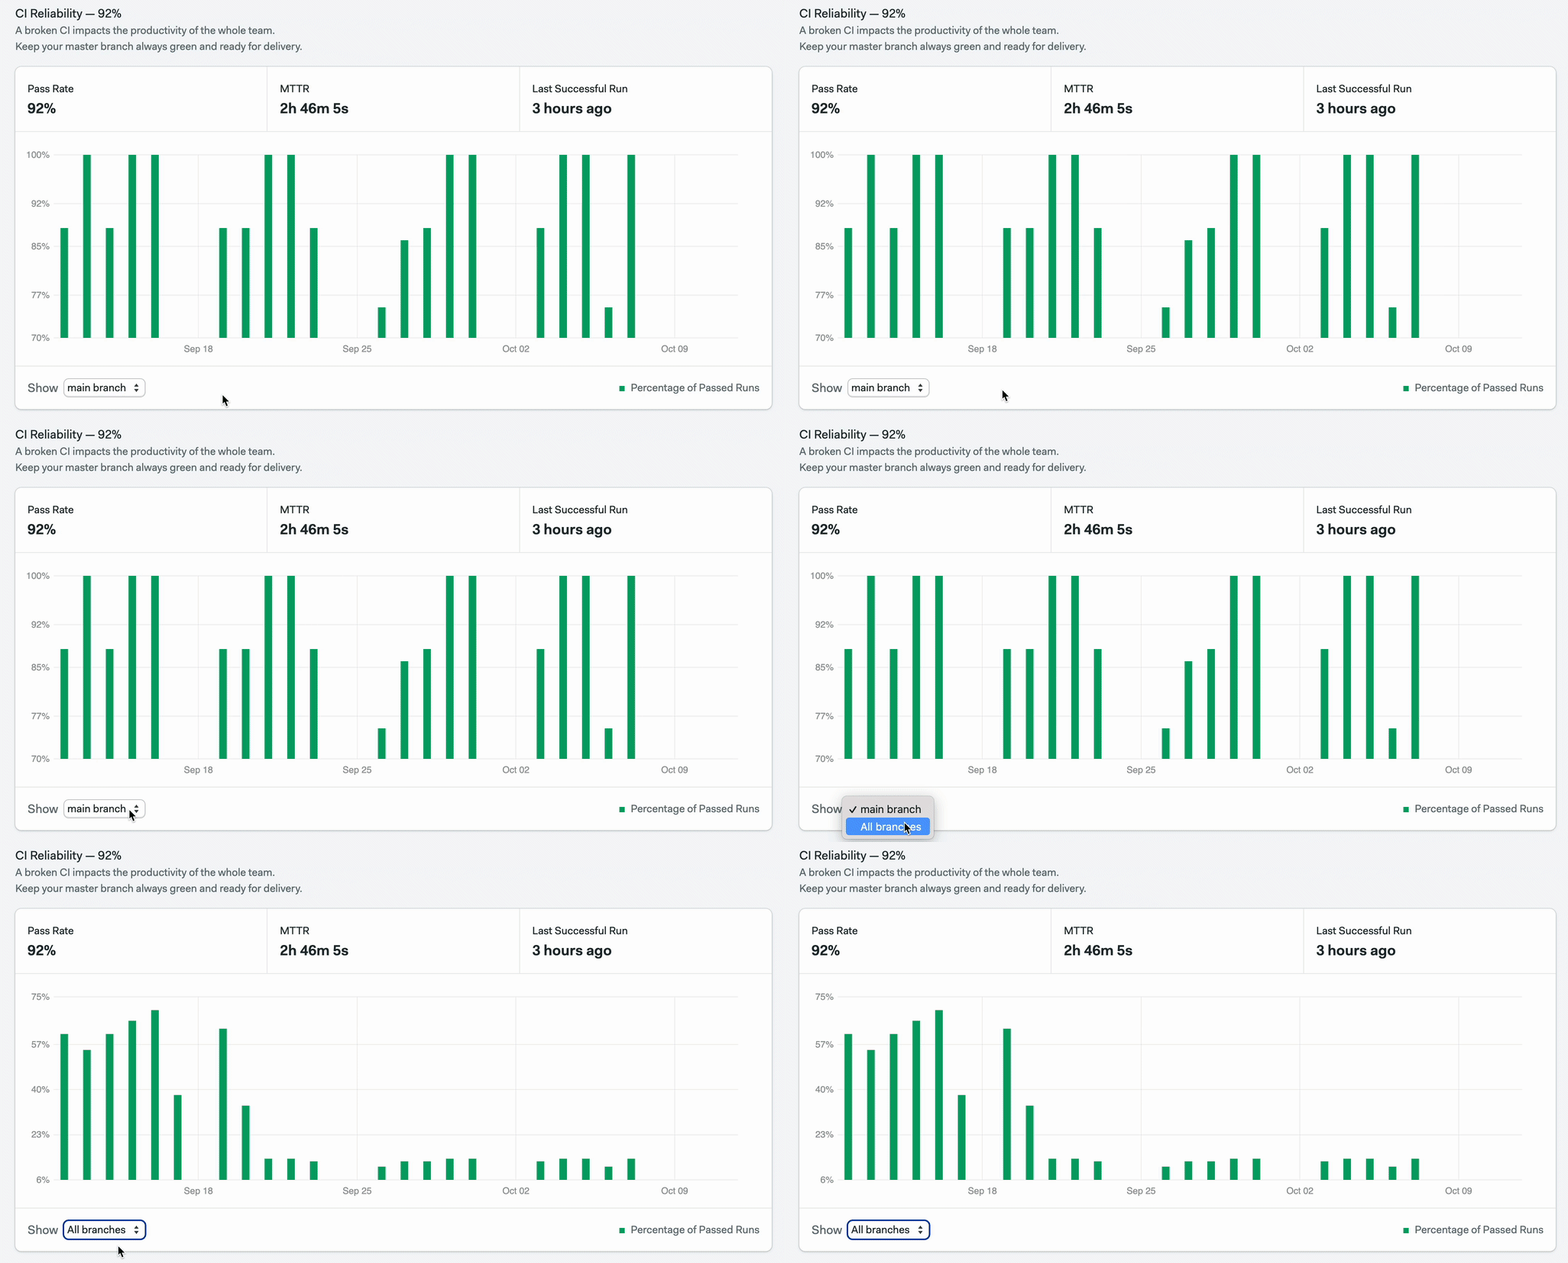
On the dashboard, you can see:
- Pass rate. It is recommended that engineering leaders monitor the pass rate of automated builds to ensure that code remains in a consistent state of production readiness.
- MTTR (mean time to recover). The average time it takes to transition from failed build to a successful one.
- Last successful run. This indicates the last time when your build ran successfully.
As with other metrics, you can also filter these by master branch or choose to see all branches.
How does Semaphore help your team to be more effective?
CI/CD performance directly affects the speed of the feedback loop. Improving CI/CD performance helps companies to improve key outcomes and accelerate the ability to deliver software with more speed and better stability.
Data-driven engineering starts with reliable metrics that can clearly demonstrate where your team stands in terms of performance. Without metrics, you’re operating in darkness, making decisions that may or may not bring results.
Project Insights will empower you to identify areas of improvement and lead your team more effectively, delivering software that makes a difference.
Conclusion
With Semaphore’s Project Insights, there’s no trade-off between speed and quality. With visual charts and reports, you get a clear overview of your CI/CD health. You get a bird’s eye view into how your organization is doing in terms of CI/CD and operational performance.
We’re planning to enhance this feature further by adding team goals, organization health detector, performance stats, and the overall Semaphore Score that will show where your team stands in terms of operational performance.
Are you interested in learning more about Semaphore’s Project Insights and improving the way your organization operates? Contact us to schedule a demo, and we’ll be happy to help.
Project Insights are available to customers on the Enterprise plan. If you’d like to configure Project Insights for your organization, please feel free to contact us at support@semaphoreci.com.
Happy building!