The ever-changing business needs of the industry have compelled design and architectural approaches to adapt in order to meet these challenges. A plethora of software architectures, designs, and styles have emerged over time. To navigate this landscape, you should possess the right tools and technologies, as well as evolving design and architecture methodologies. The way we build and manage our applications today has changed in response to recent developments in technology and design, such as containerization and microservices.
In this article, we’ll explore the basics of microservices architecture and examine how to monitor applications based on this approach.
Understanding the problem
A monolith consists of components that are tightly integrated within a single source code base. Consequently, you would build, deploy, and scale the application as a single entity. While this approach may facilitate quick debugging and testing—since all your dependencies and files are in one place—it can also lead to significant challenges in maintainability, scalability, and deployment.
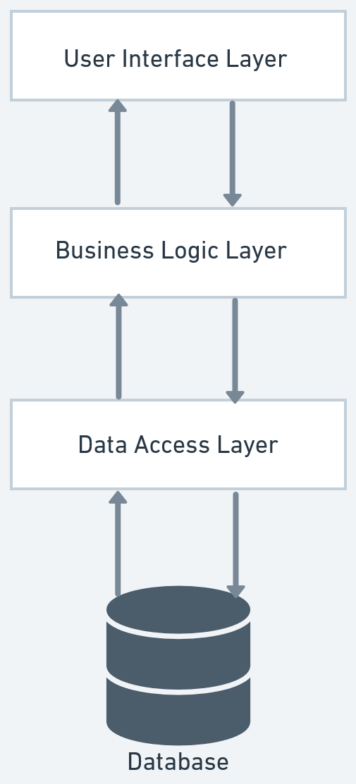
Because the components in a monolith are entangled with one another, making changes or updates can be difficult due to the tight coupling and complex dependencies among the application’s components. As a result, changes in one part of the code base can affect other parts of the application. Enter microservices architecture.
What Is Microservices Architecture?
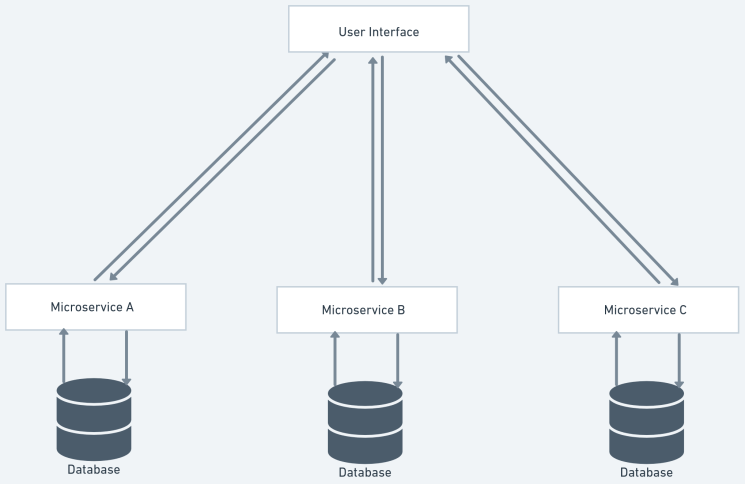
In recent years, microservices and serverless architectures have gained popularity because they offer better flexibility and scalability than their monolithic counterparts. Microservices architecture is an approach to building applications by breaking them into smaller, lightweight components. These can be tested, updated, and deployed independently, without affecting other components of the application.
Benefits of Microservices Architecture
Below are a few reasons why you should adopt a microservices architecture:
- Modularity. A microservices-based application consists of a conglomeration of several loosely coupled services, each built and deployed independently. You can scale and update each service without affecting the others because each has its own codebase.
- Service Boundaries. Each microservice represents a specific business capability and encapsulates its data storage and processing logic. Defining your service boundaries early can save you from regret later on. It’s essential to understand the boundaries and purposes of your services.
- Decentralized Data Management. Decentralized data management allows each microservice to have its own database. Typically, data is managed within the boundaries of the service; when data sharing is necessary, APIs are used for communication between services.
- Independent Deployment. Microservices can be deployed independently, facilitating faster development cycles and easier updates and bug fixes. This independence allows teams to use homogeneous or heterogeneous technologies and frameworks as needed.
- Resilience.The failure of one specific microservice does not affect other components or services. In other words, the rest of the services continue to operate during a failure, thereby enhancing the system’s overall resilience.
- Scalability. You can scale individual microservices independently, allowing for efficient resource allocation. Decoupled components make applications built using microservices architecture easier to scale.
- Inter-service Communication. Microservices often need to communicate with one another for data or information exchange. They do so through well-defined APIs, built using Representational State Transfer (REST), GraphQL, or message queues.
Why Monitor Performance in Microservices Architecture?
Distributed systems are inherently complex and dynamic. Identifying the exact cause of errors in a production environment after deployment can be exceedingly difficult. Monitoring can help organizations proactively identify and resolve performance issues, detect security threats or breaches, and improve both reliability and customer satisfaction.
Monitoring performance is crucial for maintaining smooth operations, understanding the application’s overall health, and ensuring a good user experience and efficient resource utilization. Compliance with service level agreements (SLAs) and business goals often necessitates performance monitoring.
In SLAs, both service providers and consumers agree on service levels, performance objectives, and responsibilities. Monitoring is required to assess compliance with these agreements.
Key Performance Indicators for Microservices Architecture
Key performance indicators (KPIs) measure the performance, stability, and overall health of your application. Monitoring these KPIs enables organizations to proactively detect and resolve performance issues, optimize resource allocation, and ensure a superior user experience. Here are the critical KPIs you should consider:
- Availability. This KPI measures how long individual microservices, or the entire system, are available and operational. It enables you to assess the reliability and uptime of the services.
- Response Time. This metric indicates how quickly a microservice responds to requests. It measures the time elapsed between sending a request and receiving the response. Monitoring response time helps identify bottlenecks and performance issues.
- Throughput. Throughput quantifies the number of requests or transactions a microservice can process within a given timeframe. It provides insights into the system’s ability to handle concurrent requests and its scalability.
- Latency. Latency measures the time taken from when a request is submitted until the server returns the first byte of the response. Monitoring latency can identify network or service performance issues that may adversely affect user experience.
- Scalability. This KPI assesses the system’s ability to handle increased workloads by adding resources or microservice instances. It measures how the system performs under varying loads.
- Resource Utilization. Resource utilization gauges how efficiently microservices use CPU, memory, and network bandwidth. Monitoring these key metrics helps organizations determine when additional resources or scaling efforts are required.
- Resiliency. Mean time to recovery (MTTR) measures the average time needed to recover from microservices failures or incidents. Analyzing this data enables organizations to assess system resilience and the efficiency of recovery processes.
- Reliability. The Service Dependency Health KPI evaluates the health and reliability of dependencies between microservices. Monitoring service interactions helps identify problems and optimize communication between services.
- Error Rate. This KPI quantifies the frequency and percentage of errors encountered during the execution of your microservices. It serves to assess the system’s stability and reliability while identifying areas for improvement.
Challenges in Monitoring Performance in Microservices Architecture
Typically, applications based on microservices architecture consist of multiple independent services. These services are built using either homogeneous or heterogeneous technologies and are distributed across multiple systems. Monitoring performance in such a distributed setup presents unique challenges. Here are the key challenges involved:
- Service Dependencies. As microservices interact to fulfill requests, they create a complex web of interdependencies. For efficient performance monitoring, understanding and tracking these dependencies are imperative.
- Heterogeneous Technology Stacks. Different services in microservices architecture may be built using varying technologies, platforms, communication protocols, and programming languages. This diversity makes it difficult to create a unified monitoring solution capable of seamlessly collecting and analyzing metrics from all services.
- Distributed Nature. Microservices operate independently and communicate across networks. This setup complicates the accurate monitoring of system-wide performance. Because application data is distributed, aggregating and correlating this data for performance analysis become more complex.
- Scalability. Monitoring performance becomes challenging when the number of service instances or replicas changes dynamically. As services and instances increase, so does the volume of monitoring data, necessitating scalable monitoring solutions.
- Dynamic Nature. The frequent provisioning, updating, and removal of services require monitoring solutions that can adapt to such dynamic changes.
- Complexity and Interdependencies. The intricate architecture and numerous interdependencies between services necessitate monitoring tools that can capture and analyze interactions for a comprehensive understanding of system behavior.
- Data Volume and Variety. Microservices generate large volumes of diverse monitoring data, requiring effective data storage, retrieval, and analysis.
- Cross-Cutting Concerns. Monitoring performance alongside cross-cutting issues like security, logging, and resilience necessitates careful instrumentation and tool integration.
- Tooling and Compatibility. Selecting compatible monitoring tools that integrate well with different technologies and platforms is a challenge.
Best Practices for Monitoring Performance in Microservices Architecture
To address the above challenges, organizations should adhere to the following best practices:
- Performance Metrics: Establish metrics such as resource utilization (CPU, memory, network), throughput, and response time.
- Instrumentation: Utilize frameworks like OpenTelemetry or Prometheus for collecting and reporting metrics.
- Distributed Tracing: Employ distributed tracing to identify latency issues and other bottlenecks between services.
- Centralized Logging: Create a centralized logging system for collecting, analyzing, and troubleshooting logs from all microservices.
- Real-Time Monitoring and Alerts: Use tools like Prometheus or Grafana for real-time metric monitoring and alerts.
- Auto-Scaling and Load Balancing: Implement mechanisms for efficient resource usage and load handling.
- Performance Testing: Conduct regular performance tests using tools such as JMeter or Gatling.
- Historical Data Analysis: Maintain a historical performance data repository for long-term analysis and optimization.
- Security Monitoring: Integrate security measures into the development and operations cycle.
- Continuous Improvement: Regularly monitor performance and optimize based on feedback and insights.
Tools and Technologies for Monitoring Performance in Microservices Architecture
- Logging and Tracing. Use tools like Elasticsearch, Logstash, Kibana, or Graylog for centralized logging and tracing. These tools help collect real-time logs and trace data, enhancing understanding of behavior and performance.
- Monitoring Tools. Prometheus, Datadog, and Grafana are popular choices that offer a wide range of features. Grafana excels at visualizing and analyzing data from various sources, while Prometheus specializes in collecting metrics.
- Distributed Tracing. Systems like OpenTelemetry, Jaeger, and Zipkin are recommended for tracking requests across multiple microservices. These tools offer insights into request flow, helping identify and resolve performance bottlenecks and latency issues.
- Application Performance Monitoring. Utilize APM tools like New Relic or Dynatrace for comprehensive performance data that covers application, database queries, external services, and code-level performance.
- Container Orchestration Platforms. Leverage platforms like Docker Swarm or Kubernetes for monitoring and observability. They provide metrics and health checks for containers and can integrate with third-party monitoring tools.
- API Gateways. Use API gateways such as Zuul, Kong, or Netflix to collect performance data and metrics. These gateways offer features like rate limiting, caching, and request forwarding.
- Real-Time Analytics and Alerting. An effective monitoring system requires real-time analytics and alerting tools like Prometheus, Grafana, Elasticsearch, and Kibana.
Real-World Case Studies of Monitoring Performance in Microservices Architecture
Netflix
Netflix employs Atlas for performance monitoring and observability, analyzing data, logs, and traces from hundreds of microservices. This helps them identify bottlenecks, optimize resource allocation, and increase system reliability.
SoundCloud
SoundCloud uses Prometheus and Grafana to detect performance issues and solve problems like significant service latency and frequent outages.
eBay
eBay employs OpenTracing and Zipkin to monitor its numerous microservices. This gives them comprehensive visibility into their distribution system.
Future of Performance Monitoring in Microservices Architecture
Monitoring microservices is on the cusp of significant evolution. The future will focus on observability, AI-driven monitoring, real-time analytics, and vendor-agnostic instrumentation like OpenTracing. Tools leveraging AI for observability include Instana and Dynatrace.
Integration with DevOps practices will promote collaboration and continuous improvement. Machine learning and AI-driven monitoring will provide intelligent insights and proactive problem-solving. To support root cause analysis, enhanced microservices observability and distributed tracing will offer deeper understanding of service interactions.
Conclusion
Monitoring modern systems presents multiple challenges. These systems are highly dynamic and produce vast amounts of telemetry data, especially when built on microservices architecture. As the use of microservices continues to grow, the importance of performance monitoring tools will also rise. The future of performance monitoring will be increasingly influenced by AI and machine learning, which can identify patterns and anomalies effectively.