As we journey through the rapidly developing field of digital technology, ensuring the health and resilience of your applications has become not just an option but a necessity—especially when managing complex infrastructures such as Kubernetes.
Kubernetes, the industry-leading container orchestration tool, offers mechanisms to implement robust health checks for your applications. These checks, termed “probes,” act as guardians of your application’s well-being, continuously monitoring the health status of your pods and their hosted applications. This provides a more streamlined, automated, and reliable system.
Why Should You Monitor Application Health?
Monitoring your application’s health is crucial for maintaining system stability, efficiency, and user satisfaction. No application is immune to potential errors or issues—whether it’s unexpected server downtime, performance bottlenecks, a sudden influx of user traffic, or unpredictable runtime errors. These glitches can disrupt the smooth operations of your applications and might lead to significant delays or losses. Thus, monitoring is essential, regardless of whether your application is hosted on Kubernetes or another platform.
By closely monitoring your applications’ health, you can ensure users experience a seamless and reliable service. But the advantages extend beyond that. Monitoring provides data-driven insights, facilitating informed decision-making and responsive adjustments to changes in your application’s environment. It keeps you informed about your application’s usage patterns and offers insights into user demand, helping you decide when to scale your application infrastructure in response to usage peaks.
Furthermore, monitoring enables automated responses to specific scenarios, such as deploying additional instances when application loads increase or replacing malfunctioning instances.
Staying proactive, adapting to demand, and delivering a consistent, high-performing, user-friendly application are pillars of successful application management.
How Can Probes Help?
In my experience, utilizing health checks has significantly enhanced the reliability of my applications in Kubernetes. I’ve been proactive in addressing issues before they escalate, maintaining high availability even amidst potential disruptions. The analogy I like is that of a good insurance policy: you hope you’ll never require it, but when something goes awry, you’re grateful for its presence.
While I might not have experienced a catastrophic system failure due to absent health checks, the smooth operation of my applications can be credited largely to these safeguards. They might not be center stage when everything progresses without hitches, but their foundational work is what ensures this uninterrupted flow. For instance, when I used Mongoose in my Node app to connect with a MongoDB database, I faced a setup duration before the database was fully operational. I then configured a readiness probe to ensure my application wouldn’t process traffic until the database connection was securely established. Additionally, I incorporated a startup probe to account for potential network lags that might prolong the connection phase.
Kubernetes inherently offers an automated self-healing feature, enhancing its efficacy in managing containerized applications. This innate function empowers Kubernetes to autonomously detect and rectify issues within pods, reboot an unresponsive pod, deliver rolling updates to merge application enhancements seamlessly with zero downtime, and even roll back to a prior stable version of your application if deemed necessary.
While the self-healing abilities of Kubernetes ensure a degree of resilience, layering on additional monitoring can bolster your system even more. This is where Probes become pivotal.
Probes supply Kubernetes with an in-depth grasp of your application’s health, granting the context necessary for informed decision-making and appropriate actions. With probes, Kubernetes gains insights not merely at the pod or container level but also regarding the specific state of individual applications housed within those containers.
Probes enhance Kubernetes’ self-repair features and are categorized into three types: liveness probes, readiness probes, and startup probes. The following is a list of configuration options applicable to each probe:
| Configuration Option | Description | Default value |
|---|---|---|
| initialDelaySeconds | Specifies the number of seconds to wait before a probe is initiated. | 0 |
| periodSeconds | Defines the frequency (seconds) of performing probes | 10 |
| timeoutSeconds | Defines the maximum time (seconds) a probe should take to complete. | 1 |
| successThreshold | Minimum consecutive successes for the probe to be considered successful after having failed. | 1 |
| failureThreshold | Defines the number of probe failures before Kubernetes gives up; in the case of liveness probes, this means restarting the pod. | 3 |
Each probe performs one of the following actions at the container level in the pod specification:
- httpGet: This action executes an HTTP request for a health check. The response code should be within the
200to399range. - tcpSocket: This action opens a TCP socket for a health check. The pod is healthy if a connection can be established.
- exec: This action executes a command inside the container for a health check. The pod is healthy if the command returns with exit code 0, otherwise unhealthy.
You can visit the Kubernetes official documententation to find out more about how and when to configure these actions.
With this, we can now get into the practical use case of probes.
Using Probes in Kubernetes
Understanding the theory of probes in Kubernetes is one thing, applying this knowledge to enhance your deployments is another. This guide will bridge this gap, by taking you beyond theoretical knowledge of probes in Kubernetes to practical applications that can enhance your deployments.
You’ll gain a comprehensive understanding of these probes, their capabilities, and their practical applications.
This knowledge will help you enhance the resilience and responsiveness of your applications and fully utilize the potential of Kubernetes for seamless scaling and smart management of containerized workloads.
Prerequisites:
To effectively utilize this tutorial, you’ll need a text editor, Kubernetes and kubectl installed on your Windows, Linux or Mac machine and an operational Kubernetes cluster – either locally or cloud-based, with at least one node. For a local cluster, options like Minikube or Kind will work fine, providing straightforward and efficient cluster provisioning.
On the other hand, for cloud-based cluster setups, services like Amazon’s EKS (Elastic Kubernetes Service), Google’s GKE (Google Kubernetes Engine), or Microsoft’s AKS (Azure Kubernetes Service) can be leveraged.
Regardless of your choice, ensure your cluster is up and running smoothly before proceeding. This will ensure you can readily apply the concepts and techniques demonstrated in this tutorial to your Kubernetes environment.
Configuring the Liveness Probe
The Liveness Probe is a mechanism employed by Kubernetes to determine if an application within a container is still running. If the liveness probe fails, Kubernetes will automatically restart the container. This feature is particularly beneficial for applications such as web servers, microservices, messaging, and database systems, where a simple restart can rectify many issues that may otherwise cause the application to crash.
To implement the Liveness Probe, we define a liveness command, a TCP socket, or an HTTP request that Kubernetes can use to check the health of the application.
Here is an example of a Liveness Probe that runs a command inside a container:
livenessProbe:
  exec:
    command:
    - cat
    - /tmp/health
  initialDelaySeconds: 5
  periodSeconds: 5
The liveness probe in the above example operates as follows:
- Executes the
cat /tmp/healthcommand inside the container. - Uses the
initialDelaySecondsfield to specify the duration to wait before conducting the first check. - Defines the frequency of the health checks of the application with the
periodSecondsfield.
Let’s consider a more practical scenario, where we’ll deploy a Node.js container image with a memory leak. Memory leaks can degrade performance over time until the application becomes completely unresponsive.
In this scenario, we’re going to deploy this container image and equip it with a liveness probe. The objective here is to observe the liveness probe in action as it detects the memory leak automatically and restarts the application, thereby resolving the issue by clearing the memory temporarily and giving the system administrator ample time to identify and rectify the root cause of the memory leak permanently.
Create a yaml file called node-app and paste in the following configuration settings:
# node-app.yaml
apiVersion: apps/v1
kind: Deployment
metadata:
  name: node-app
spec:
  replicas: 3
  selector:
    matchLabels:
      app: node-app
  template:
    metadata:
      labels:
        app: node-app
    spec:
      containers:
      - name: nodejs-app
        image: mercybassey/memory-leak
        ports:
        - containerPort: 3000
        livenessProbe:
          httpGet:
            path: /health-check
            port: 3000
          initialDelaySeconds: 15
          periodSeconds: 5
This configuration setting above will create a Kubernetes deployment object, set to launch a Node.js application designed to simulate a memory leak issue when subjected to a high volume of requests. The deployment consists of three replica pods, each running the Docker image named “mercybassey/memory-leak”.
The liveness probe associated with each pod sends HTTP GET requests to the “health-check” endpoint on port 3000 of the container, starting 15 seconds after the pod launches and repeating every 5 seconds thereafter.
Should the Node.js application become unresponsive (and hence, the liveness probe fails), Kubernetes will take a corrective action by automatically restarting the container which will temporarily handle the memory leak until a permanent fix is implemented in the application’s code.
To create this deployment, execute the following kubectl command:
kubectl apply -f node-app.yaml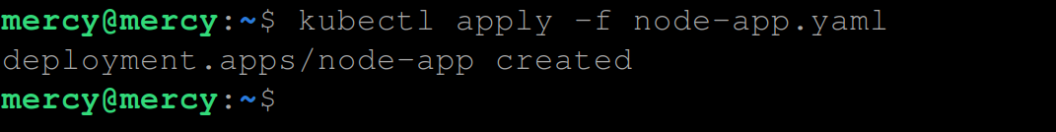
Run the kubectl commands to view the deployment and the pods created by the deployment:
kubectl get deployment
kubectl get pods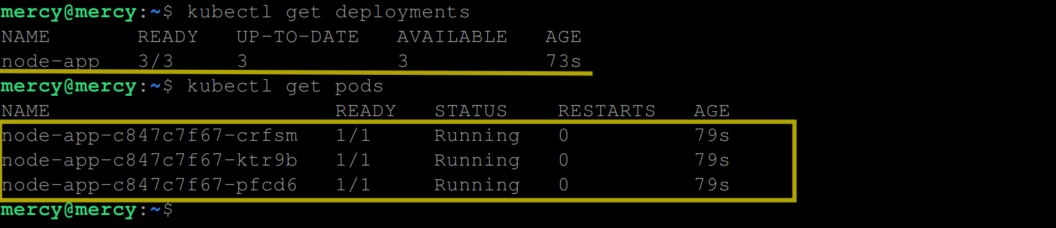
Next, we need to expose the “node-app” deployment via a Kubernetes service object to facilitate HTTP GET requests to the pods.
Create a “yaml” file named “service.yaml” with the following configuration:
# service.yaml
apiVersion: v1
kind: Service
metadata:
  name: nodejs-service
spec:
  selector:
    app: node-app
  type: NodePort
  ports:
    - port: 3000
      targetPort: 3000
      nodePort: 30000
This configuration will create a Kubernetes service object of the NodePort type, thereby exposing the “node-app” deployment on port 3000.
To create this service object, run the following kubectl command:
kubectl apply -f service.yamlRun the following kubectl command to view the service:
kubectl get services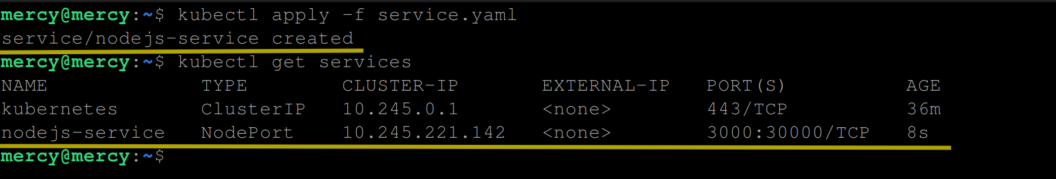
To observe the liveness probe in action, we need to direct a large volume of HTTPS GET requests to the “/health-check” route. This can be accomplished using a load testing tool or HTTP benchmarking tool such as Siege which we will deploy on our Kubernetes cluster.
Create a “yaml” file named “siege” with the following code:
# siege.yaml
apiVersion: apps/v1
kind: Deployment
metadata:
  name: siege
spec:
  replicas: 1
  selector:
    matchLabels:
      app: siege
  template:
    metadata:
      labels:
        app: siege
    spec:
      containers:
      - name: siege
        image: dockersec/siege
        command: ["siege", "-c", "40", "-t", "1M", "http://10.245.221.142:3000/"]
Considering the code above, a Kubernetes deployment object will be created using the “dockersec/siege” image, which is a pre-built image for the Siege load testing tool. The command specified in the command field tells Siege to run a load test with 40concurrent users (-c 40) for 1 minute (-t 1M) against the specified URL (http://10.245.221.142:3000/) which is in this case the NodePort service exposing our Node.js deployment.
Now use the following kubectl command to create and view this deployment:
kubectl apply -f siege.yaml
kubectl get deployments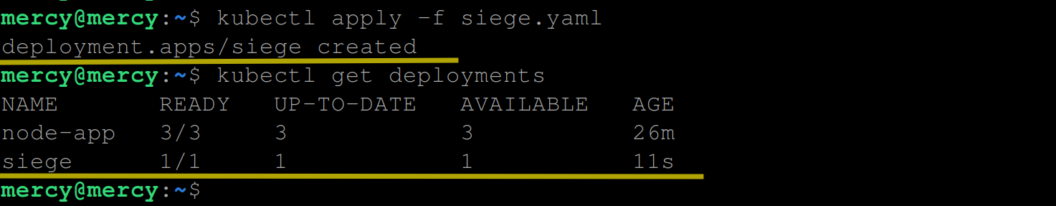
To observe the liveness probe in action, you can periodically monitor the status of the pods by executing the following command:
kubectl get pods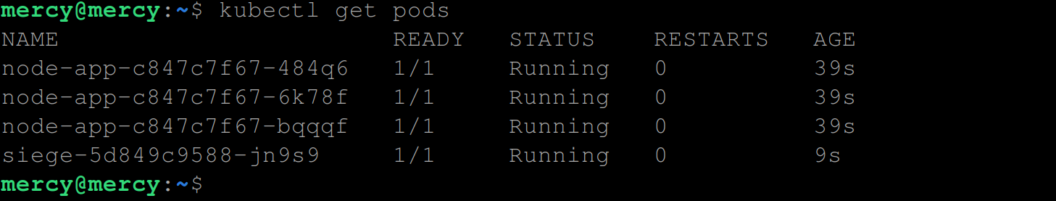
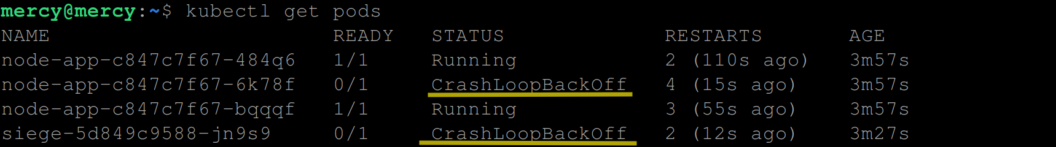
At this stage, you shouldn’t notice any restarts. However, as you continuously monitor the status using the above command, you may eventually notice an increment in the “restarts” count:
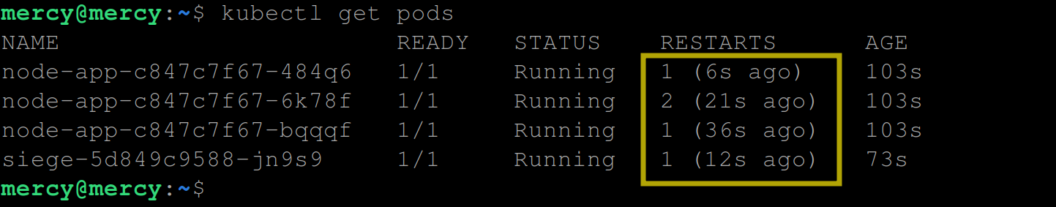
This indicates that the liveness probe is doing its job by telling Kubernetes when to restart unresponsive pods.
When the Siege load testing tool completes its one-minute runtime, the siege pod will transition into a completed state, indicating that it has finished its task.
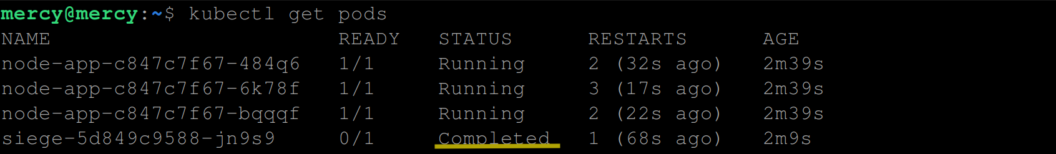
Subsequently, the siege pod prepares to initiate another round of requests, with the intensity of 40 concurrent requests per minute.
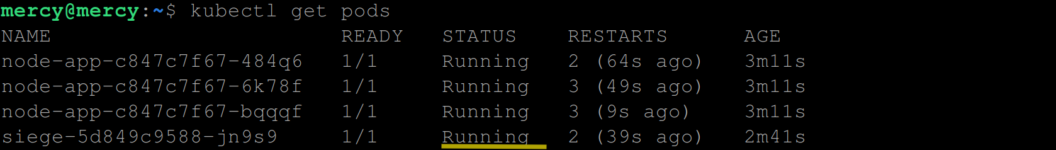
As the second round of high-volume requests kicks off, the pods continue to experience memory leaks and restart as necessary. This process continues until one or two instances of the application transition into a CrashLoopBackOff state. This state is a mechanism employed by Kubernetes to avoid continuous restarts if a pod repeatedly crashes shortly after being restarted, as is the case here due to the continual memory leak triggered by the high-volume requests from the siege pod.
Furthermore, the siege pod itself can also reach the CrashLoopBackOff state if it exhausts its available resources. This could potentially occur due to the pod’s need to manage an extensive number of concurrent connections, or its inability to handle the subsequent restarts on the Node.js side.
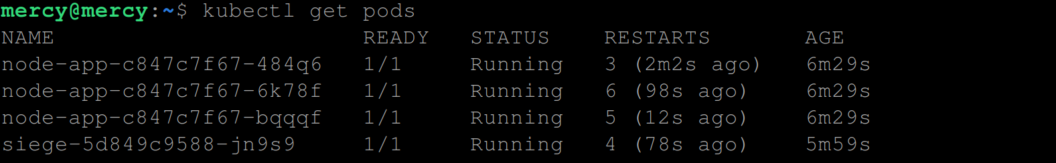
When a pod lands in the CrashLoopBackOff state, Kubernetes temporarily backs off and delays restart attempts. It will make further attempts to restart the pods, allowing them to recover from the CrashLoopBackOff state and transition back into a running state.
Now this is how the liveness probe works. Though we’ve used the Siege tool to simulate high-traffic conditions, in a real-world scenario, the incoming requests would be generated by actual users interacting with your application.
In situations where a pod running in Kubernetes crashes frequently after restarting, Kubernetes smartly transitions the pod into a CrashLoopBackOff state. This intelligent mechanism allows Kubernetes to impose a delay before attempting to restart the pod again, preventing a rapid, inefficient cycle of restarts and crashes.
While one instance of the application is navigating through the CrashLoopBackOff state, other instances remain active and can continue processing user requests. This prevents total service interruption, thereby demonstrating the necessity of maintaining multiple concurrent instances of your application.
Therefore, it is vital to architect your applications with high availability in mind, in other to ensure that multiple instances or replicas are running concurrently. This helps reduce potential downtime and provides a seamless experience for your users, even when some instances are experiencing problems. However, this can lead to an increased workload for the remaining active instances of your application (or pods), but is a discussion for another day.
Configuring the Readiness Probe
The readiness probe is a functionality provided by Kubernetes to determine if a pod is ready to accept requests or, in other words, ready to serve traffic. When a pod is not ready, it is temporarily removed from the service load balancers to prevent it from receiving traffic. This feature is particularly useful for applications that have a significant initialization time or for applications that dynamically manage their readiness based on internal factors.
To demonstrate how a readiness probe works, let’s deploy a Node.js application that simulates a cache check operation for 10seconds at startup. The application isn’t ready to serve traffic until this cache check is complete.
We will use a “yaml” file called “cache” with the following configuration settings:
# cache.yaml
apiVersion: apps/v1
kind: Deployment
metadata:
  name: node-cache-app
spec:
  replicas: 3
  selector:
    matchLabels:
      app: node-cache-app
  template:
    metadata:
      labels:
        app: node-cache-app
    spec:
      containers:
      - name: nodejs-app
        image: mercybassey/cache
        ports:
        - containerPort: 3000
        readinessProbe:
          httpGet:
            path: /ready
            port: 3000
          initialDelaySeconds: 10
          periodSeconds: 5
The configuration setting above is expected to create 3 replicas of the application named node-cache-app. The application runs in a container using the mercybassey/cache image and listens on port 3000.
The readiness probe is configured to make an HTTP GET request to the /ready endpoint of the application every 5 seconds (periodSeconds: 5), but it will wait for 10 seconds (initialDelaySeconds: 10) before performing the first probe.
The configuration aims to ensure that the application is ready to serve requests before it gets traffic.
If the application takes some time to initialize (for example, to load data into the cache or establish database connections), the readiness probe gives it the time it needs. Kubernetes will only start sending traffic to this pod once the readiness probe gets a successful response from the /ready endpoint.
If, for any reason, the application becomes unready (for example, if it needs to refresh its cache or reconnect to the database), the readiness probe will fail, and Kubernetes will stop sending traffic to that pod until it becomes ready again.
This means that Kubernetes will not send any traffic to a newly created pod from this deployment until at least 10 seconds have passed and the application returns a successful response for the readiness probe. From then on, the probe is checked every 5second.
This approach helps in scenarios where your application might need a few moments after starting to fully initialize and be ready to receive traffic. By using the readiness probe this way, you can ensure that Kubernetes only routes traffic to your pod once it’s fully ready to handle it, thereby potentially avoiding any failed requests that might occur if traffic was sent to the pod too soon.
To create the deployment and view its status use the following kubectl commands:
kubectl apply -f cache.yaml
kubectl get deployments
You can view the pods created by this deployment and their readiness status with the following kubectl command:
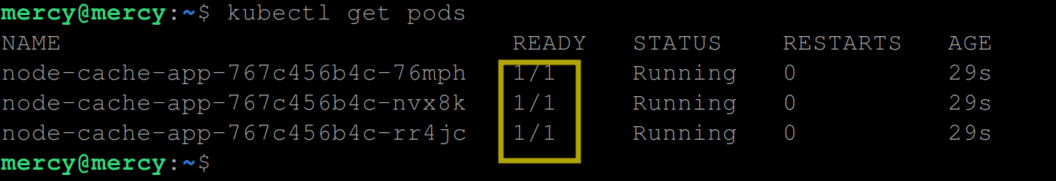
kubectl get pods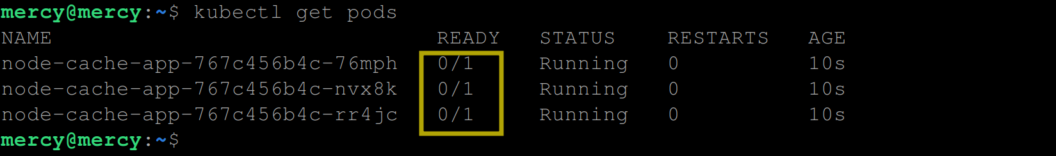
Initially, the readiness status of the pods shows 0/1, indicating that the containers in the pods are not ready yet to serve traffic. However, after the cache check operation is complete (after about 10 seconds), the readiness status changes to 1/1, signifying that the application is now ready to serve traffic.
This is basically how the readiness probe works. However, unlike the liveness probe above, if this probe fails the Pod is not restarted – it simply will not be sent any traffic until it’s ready.
Configuring the Startup Probe
Just as the name implies, this probe checks if an application within a container has successfully started. If the startup probe fails, Kubernetes assumes that your application is still starting and waits for a while. If the startup probe passes, then any configured liveness and readiness probes will come into effect.
To demonstrate this, we will deploy a Node container image with a long startup time. This container image comprises two routes – the home / route and the /health route. Based on how this container image is designed, once it is run, it starts after 30seconds. And until it starts every other route or part of the application is unaccessible.
To deploy this application create a “yaml” file called “startup” with the following configuration settings:
# startup.yaml
apiVersion: apps/v1
kind: Deployment
metadata:
  name: node-app
spec:
  replicas: 3
  selector:
    matchLabels:
      app: node-app
  template:
    metadata:
      labels:
        app: node-app
    spec:
      containers:
      - name: nodejs-app
        image: mercybassey/startup
        ports:
        - containerPort: 3000
        startupProbe:
          httpGet:
            path: /
            port: 3000
          failureThreshold: 30
          periodSeconds: 1
        livenessProbe:
          httpGet:
            path: /health
            port: 3000
          initialDelaySeconds: 45
          periodSeconds: 5
This Kubernetes Deployment defines a set of 3 Pods, each running a Node.js application served from the Docker image referenced as mercybassey/startup exposed and expected to run on port 3000.
For each pod, a startup probe is defined that sends an HTTP GET request to the path / on port 3000 of the pod. This probe is sent every 1 second (periodSeconds: 1) until a success response is returned. If the probe does not get a success response within 30 attempts (failureThreshold: 30), Kubernetes will consider the startup probe as failed and will kill the container and start it again. This gives the application 30 seconds to start up successfully before Kubernetes decides that the pod failed to start.
After the application has started and the startup probe has passed, the liveness probe kicks in. The liveness probe also sends an HTTP GET request, but it sends it to the “/health” endpoint on port 3000. However, this probe does not start until 45 seconds after the container has started (initialDelaySeconds: 45) and then continues to check the health of the application every 5seconds (periodSeconds: 5).
If the “/health” endpoint returns a non-success response, Kubernetes will consider the liveness probe as failed. By default, if the liveness probe fails 3 times in a row (which is the failureThreshold, defaulted to 3), Kubernetes will consider the pod to be unhealthy and will kill and restart it.
So based on these configuration settings, the startup probe gives the Node application 30 seconds to start up, after which the liveness probe gives it a 45-second grace period before it starts monitoring the health of the application. After the grace period, the liveness probe checks the health of the application every 5 seconds.
Now execute the following command to create and view this deployment:
kubectl apply -f startup.yaml
kubectl get deployments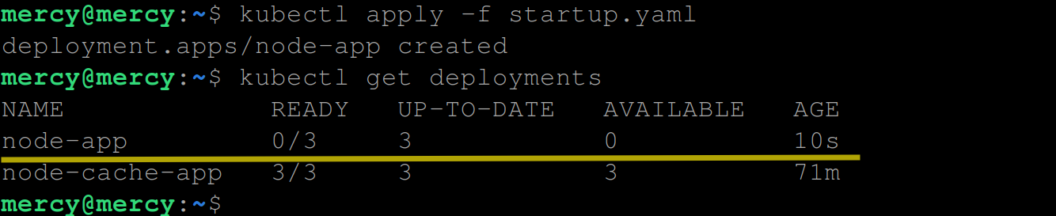
From the output above, you can see that the containers in the pods haven’t started yet, hence it says ‘0/3’.
You can also confirm that the pods also have a ready state of 0/1:
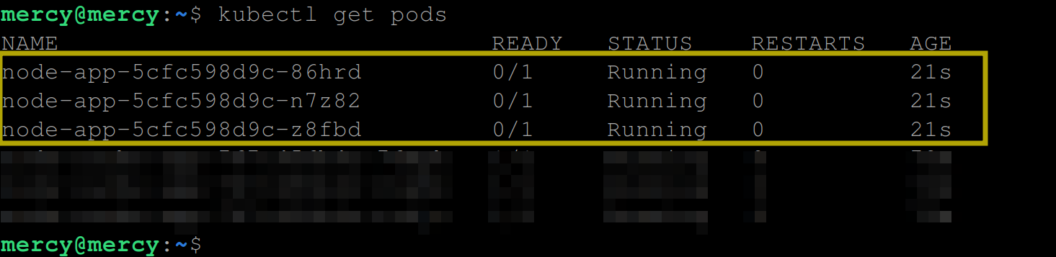
Indicating that the container in the pods hasn’t started yet. Otherwise, you get to see the following output indicating that the containers in the pod have successfully started:
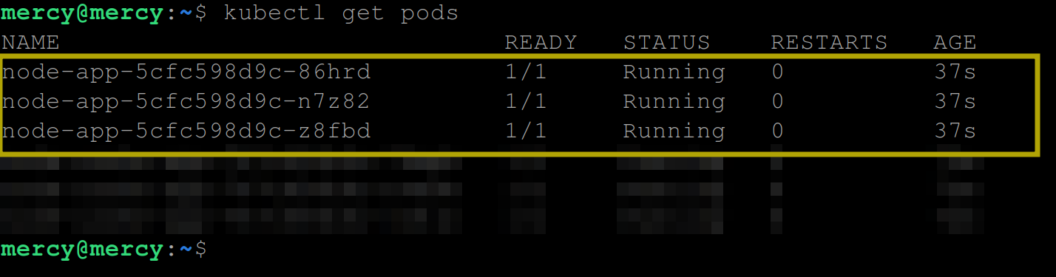
At this point, the liveness probe can proceed to periodically check the liveness of the containers in the pod.
Conclusion
Probes are critical components in the Kubernetes ecosystem that ensure the health and availability of your applications. As we’ve explored, liveness, readiness, and startup probes play vital roles in monitoring your applications, each with a unique and significant part to play.
While the liveness probe monitors the ‘aliveness’ of your applications, ensuring that failing containers are restarted, the readiness probe checks if your application is ready to serve traffic, preventing it from receiving requests until it is fully prepared. On the other hand, startup probes provide an additional buffer for applications that require a longer startup time, allowing them time to initialize before other probes kick in.
You might be wondering why there’s a need for these probes when monitoring tools like Grafana are available. The key difference lies in their roles and approaches. While tools like Grafana provide excellent visualizations and an overview of system health, probes are Kubernetes’ first line of defense in managing application availability directly at the container level.
Monitoring tools help detect problems, but probes proactively prevent issues by controlling traffic flow to containers and managing container lifecycles based on their state. By integrating these different levels of monitoring – from the high-level Grafana dashboards to the control of probes – you can achieve a more robust, resilient, and reliable application environment within Kubernetes.

Great Blog about Kubernetes probes – startup, liveness and readiness. Thanks 👍
Thank you, Good overview about how we can implement all three types of probes. Can you please help me understand how /health-check endpoint is implemented to identify the memory issues.
The /health-check endpoint informs the Kubernetes liveness probe that the application is operational by returning a status code of 200. When the application experiences a memory leak due to high traffic, it becomes unresponsive and enter a CrashLoopBackOff state. This makes the /health-check endpoint unreachable, causing the liveness probe to fail. That’s basically how it works. Here’s the code on GitHub: https://github.com/mercybassey/memory-leak