Debugging is a critical aspect of software development; it plays a vital role in ensuring the reliability and stability of applications. Debugging lets you find and fix your application’s errors, bugs, and unexpected behaviors Regardless of your level of expertise, embracing debugging as an integral part of your development workflow is good practice since debugging also enhances your projects’ overall code quality, performance, and maintainability.
Go provides a robust set of built-in debugging tools that you can use to debug your apps. The tools provide functionality for inspecting variables, tracking program execution, setting breakpoints, and gaining valuable insights into your code’s behavior.
Identifying Bugs in Your Go Apps
Bugs are inevitable in software developments, and Go applications are no exception. Identifying and fixing bugs is crucial for maintaining the stability and reliability of your Go apps.
You’ll need to be conversant with the common types of bugs in Go applications to tackle them squarely.
Here are some of the common bugs you’ll find in Go applications:
- Null pointer dereference occurs when a variable or pointer is accessed without proper initialization or assignment, leading to crashes and unexpected behavior.
- Out-of-bounds errors that occur when accessing arrays, slices, or strings with invalid indices result in panics or data corruption.
- Goroutine synchronization issues are concurrency bugs that arise when goroutines aren’t properly synchronized, leading to race conditions, deadlocks, or incorrect data sharing.
- Resource leaks are caused by a failure to release resources like a database connection or file handles. These problems can cause memory or file descriptor leaks, impacting app performance and scalability.
- Type conversion errors happen due incorrect type conversios and can introduce subtle bugs, such as data loss or unexpected behavior due to incompatible types.
Consequentially, here are some strategies for identifying and reproducing bugs in your programs
- Start by understanding the steps to reproduce the bug consistently. Identify the specific inputs, dependencies, or conditions that trigger the bug. Reproducing the bug is crucial for effective debugging.
- Isolate the bug if the bug is not immediately apparent. You can use techniques like binary search to narrow down the code section where the bug occurs. Temporarily remove unrelated code or simplify the program until the bug is isolated.
- Leverage Go’s built-in debugging tools, such as the debugger (Delve) and profiler. These tools provide valuable insights into the state of your application, stack traces, variable values, and performance characteristics.
- Strategic logging and tracing can help pinpoint the location and cause of bugs. Insert log statements at critical points in your code and output relevant information, such as variable values and function execution paths. Use structured logging to make analysis easier.
- Write comprehensive unit tests that cover different scenarios and edge cases. When you discover the bug, create a unit test that reproduces the issue to ensure that you fix the bug, and there’s no reoccurrence.
- Use techniques such as Test-Driven Development (TDD) or Behavior-Driven Development (BDD) to design your code.
Tips for Utilizing Logging and Error Handling for Identifying Bugs
Logging is a process of recording information about the execution of a program, including the values of the variables, the sequence of execution, and the time of the events.
Error handling is the process of responding to errors during program execution.
Logging and error handling are effective for identifying and fixing bugs. By logging information about a program’s execution, you can track down the source of the error and respond to the error to prevent further problems with error handling.
Here are some tips for utilizing logging and error-handling practices for identifying bugs:
- Use error return values, check, and handle errors diligently to prevent bugs from propagating through the application. Avoid swallowing or ignoring errors in your programs.
- Wrap errors with additional context using libraries like Go’s built-in errors.Wrap function to add valuable context on where the error originated to aid your bug identification process.
- Use structured logging libraries like zap or logrus to log meaningful information in a structured format like JSON, where you can include relevant data, timestamps, and log levels. Structured logs facilitate easier analysis and debugging.
- When handling errors, log stack traces to identify the exact code path leading to the error. Stack trace information is invaluable for debugging. You can use Go’s built-in runtime/debug package for logging stack traces.
- Employ error monitoring and aggregation tools like Sentry, LogRocket, OpenReplay, or Rollbar to collect and analyze error reports from your production environment. These tools provide insights into recurring errors and help prioritize bug fixes.
- Configure your CI platform to show error details. On Semaphore, you can do this by setting up test report dashboards.
By following these tips, you should be able to identify the bugs in your Go project.
Best Practices for Debugging Your Go Apps
The sequence of actions you take while developing your app is crucial for maintaining high-quality applications.
Here are some best practices you’ll want to have in mind and follow during your app’s development process to get rid of unnecessary bugs
Write Testable Code
Writing testable code forms the foundation for effective debugging. By designing your app with testability in mind, it’s easier to identify and isolate issues.
Embrace unit testing and strive for comprehensive code coverage. Well-designed tests act as a safety net, enabling you to catch errors early on and debug efficiently.
You can use tools like Go’s built-in testing package or third-party packages like Testify to automate the testing process and ensure codebase stability.
Use Panic and Recovery Mechanisms
Go’s panic and recovery mechanisms are potent error handling and debugging tools. You can use panics to abruptly cease program execution and recovery to regain control and handle a panic gracefully.
By strategically incorporating panic and recovery in your code, you can capture critical error scenarios, log relevant information and handle failures gracefully. Use panic when anticipating unrecoverable errors and recovery from panics to prevent program termination.
Here’s a program that illustrates the usage of panic and recovery:
package main

import "fmt"

func recoverFromPanic() {
	if r := recover(); r != nil {
		fmt.Println("Recovered from panic:", r)
	}
}

func performDivision(a, b int) {
	defer recoverFromPanic()
	if b == 0 {
		panic("Division by zero")
	}
	result := a / b
	fmt.Println("Result:", result)
}

func main() {
	fmt.Println("Start")
	performDivision(10, 2)
	performDivision(8, 0)
	performDivision(12, 3)
	fmt.Println("End")
}

// Start
// Result: 5
// Recovered from panic: Division by zero
// Result: 4
// End
The recoverFromPanic function uses the recover function to catch and handle panics by checking if there’s a panic before printing a message indicating recovery from a panic.
The performDivision function demonstrates the usage of a panic. If the second argument b is zero, it triggers a panic by calling the panic function. Otherwise, the performDivision function performs the division operation and. prints the result.
You call the performDivision function thrice with different arguments in the main function. The second call triggers a panic due to an error that’s eventually recovered from with the recoverFromPanic function.
The program demonstrates how you can use panic and recovery to handle exceptional situations gracefully in Go programs.
Debugging in a Development Environment
Debugging in a controlled environment is essential before deploying your app to production. You can use tools like Delve to step through your code, set breakpoints, and inspect variables by iteratively debugging in a development environment to catch and resolve issues early and reduce the likelihood of encountering bugs in production.
Golang Debugging Tools
Go ships with several built-in tools that facilitate efficient debugging, and there are third-party packages for debugging in Go’s ecosystem that provide insight into code execution, help identify issues and optimize performance. One popular Go debugger is Delve. Delve is a powerful tool that you can use to step through code, set breakpoints, and inspect variables at runtime.
Delve is cross-platform since it provides both CLI and IDE functionality for debugging.
Run this command in the terminal of your project’s working directory to install Delve.
go install github.com/go-delve/delve/cmd/dlvOnce you’ve installed Delve, you can proceed to debug your apps. One helpful measure for debugging apps is stepping through code to inspect variables.
Stepping Through Code and Inspect Variables With Delve
“Stepping through code” is executing a program line by line to observe its behavior instead of running the entire program at once. As you step through the code, you can examine how the state of your program changes, set breakpoints at specific lines, and pause the program.
On the other hand, inspecting variables involves examining the current values stored in different variables during program execution. You get to view the values of local and global variables to understand how they’re changing and potentially causing issues to track the flow of data and determine where errors are occurring.
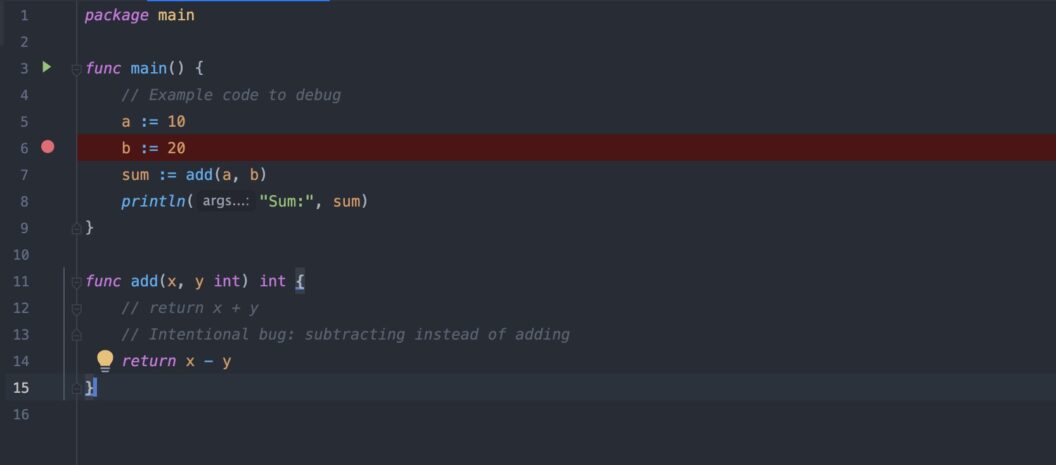
Here’s an example Go program for debugging:
package main

func main() {
	// Example code to debug
	a := 10
	b := 20
	sum := add(a, b)
	println("Sum:", sum)
}

func add(x, y int) int {
  	// return x + y
  // Intentional bug: subtracting instead of adding
	return x - y
}
To debug the program with Delve, you’ll need to install the Delve CLI tool on your machine. Once installed, you can run the program with the dlv debug command followed by the program’s path:
dlv debug main.goThe command will start the Delve debugger and load the program for debugging. Delve will display a (dlv) prompt, indicating that you can now execute debugger commands.
Here’s a table of the debugger commands and their functionality:
| Command | Description (Functionality) |
|---|---|
| b or breakpoint | Sets a breakpoint at the specified location. For example, you can set a breakpoint at line 6 with breakpoint main.add. |
| c or continue | Continues the execution of the program until the next breakpoint or the program exits. |
| n or next | Executes the next line of code. |
| s or step | Steps into functions. |
| p or print | Prints the value of the specified variable. |
| q or quit | Exits the debugger. |
Use the appropriate commands to navigate your code, set breakpoints, inspect variables, and step through the program’s execution to identify and debug any issues.
You can use the help command in Delve for a complete list of available commands and their descriptions. In this case, set a breakpoint at line 14, right before the println statement:(dlv) b main.go:11
Continue the program’s execution:
(dlv) continue
The program will run until it hits the breakpoint. Delve will stop at the specified line, and you can now inspect the variables and their values to identify the bug.
You can print the value of the variable with the print command followed by the variable name as thus:
(dlv) p xDelve will display the value of x in the debug console.
You can step through the code with the following command with n to execute the next line of code and trace the program execution.
(dlv) nAs you step through the code, you’ll reach the line with the bug and see that sum has an unexpected value due to the subtraction bug. You can analyze the variables and code logic to identify and fix the issue.
Profiling Your Go Code With Pprof
Another efficient measure of debugging your Go code is profiling. Profiling allows you to gather runtime information about the performance of your program to help you identify bottlenecks and areas of improvement.
Go provides a built-in profiling tool called pprof for collecting and analyzing profiling data.
Here’s how you can start a profiler on a file creation operation:
package main

import (
	"os"
	"runtime/pprof"
)
func main() {
	f, err := os.Create("cpu_profile.prof")
	if err != nil {
		panic(err)
	}


	err = pprof.StartCPUProfile(f)
	if err != nil {
		panic(err)
	}
	defer pprof.StopCPUProfile()
}
The program imports the os and pprof packages. The main function creates a file with the os.Create function and a deferstatement calls closes the file stream with the Close function; then the function calls the pprof.StartCPUProfile function that takes the file f as an argument and starts profiling the CPU usage of the program. Another defer statement is used to ensure that pprof.StopCPUProfile is called at the end of the main function, and the data collected is flushed to the file.
You can use the go tool pprof command-line tool to analyze the profiling data. You can run this command to analyze a CPU profile snapshot:
go tool pprof <profile-file>
go tool pprof cpu_profile.prof
You’ll replace <profile-file> with the path to the profile snapshot file generated by the program.
Here’s the result of running the command for the program above:
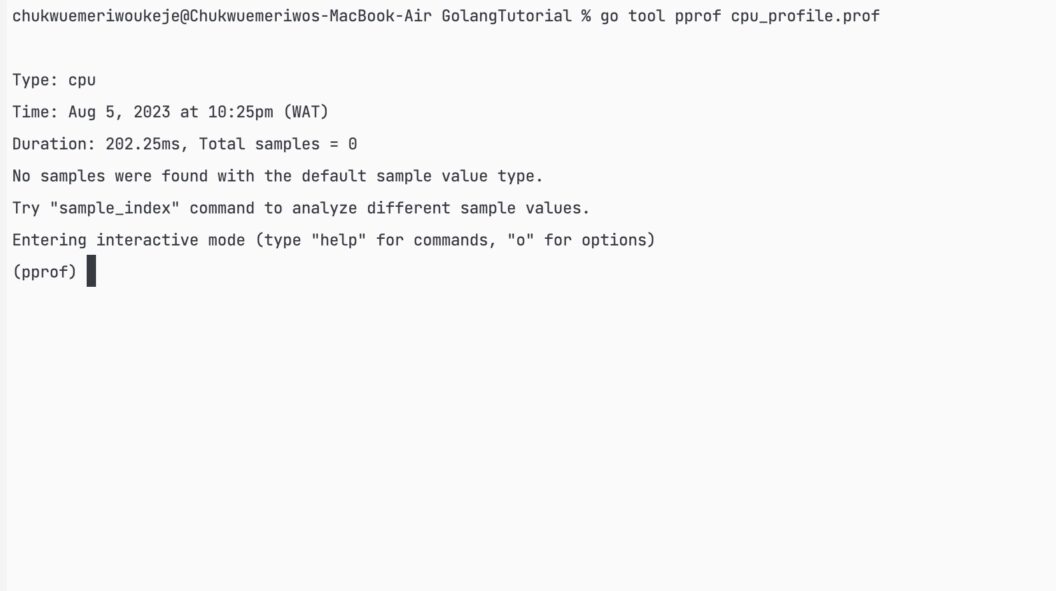
The go tool pprof provides various commands and options to explore the collected profiling data. You can use the top command to see the functions consuming the most CPU time or the web command to generate an interactive graphical visualization of the profile.
By analyzing the profiling data, you can identify performance bottlenecks in your code. The information from profiling can guide you in optimizations and improving your Go program’s overall efficiency.
The Debugging Process With Goland
GoLand, the integrated development environment (IDE) developed by Jetbrains for Go, offers robust debugging tools for enhancing the debugging process and streamlining development workflows.
With GoLand, you get intelligent code completion, code inspection, and error highlighting, ensuring you write clean and error-free code. The IDE also includes powerful refactoring tools that enable you to restructure your code without introducing bugs.
GoLand provides a feature-rich debugger that lets you step through your code, inspect variables, set breakpoints, and more.
You can easily set breakpoints in the GoLand IDE by clicking on the left-hand gutter next to the line where you want to set a breakpoint. The red dot specifies that you’ve set a break-point.
You can set breakpoints on any line of code with GoLand:
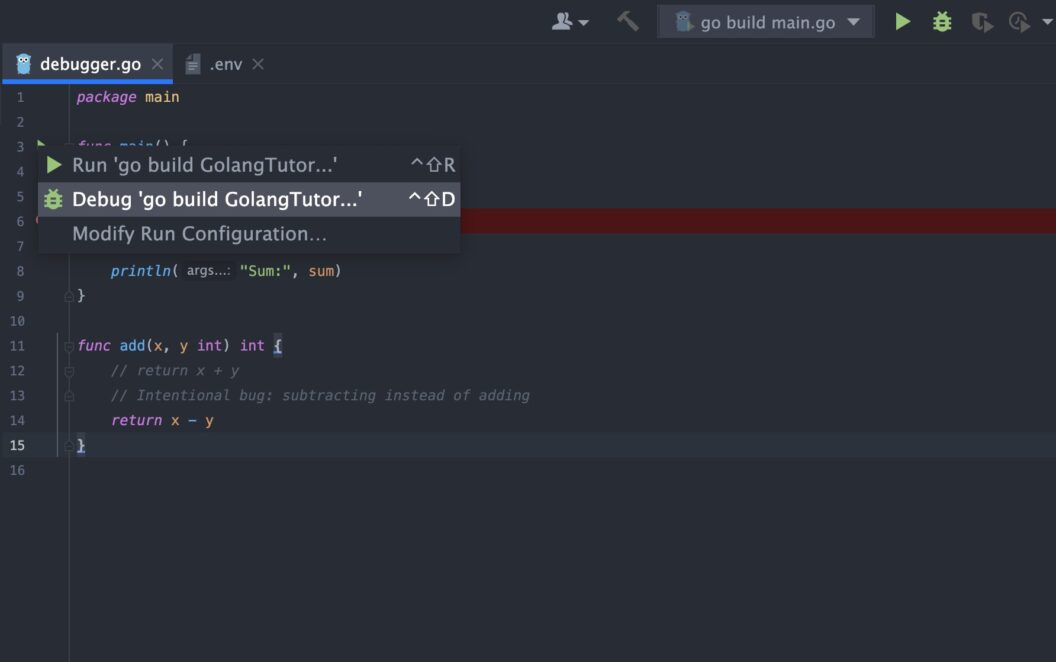
After setting a breakpoint, you can start the debugger by clicking the green Debug button in the toolbar or the keyboard shortcut for debugging on your operating system. Running the debugger will pause the code execution at the first breakpoint it encounters.
Once the program pauses at a breakpoint, you can step through the code to understand its flow and identify issues. GoLand provides multiple options for stepping through code.
Here’s an overview of the commands and their description:
| Command | Description |
|---|---|
| Step Over (F8) | Executes the current line and moves to the next line. If the current line contains a function call, it will be executed without stepping into the function. |
| Step Into (F7) | Executes the current line and steps into any function call on that line, allowing you to explore the internal workings of functions. |
| Step Out (Shift+F8) | Executes the remaining lines of the current function and returns to the calling function. |
| Run to Cursor (Alt+F9) | Runs the program until it reaches the line where the cursor is currently positioned without setting a permanent breakpoint. |
Inspecting variables and expressions to understand their dynamics is crucial during your debugging process. GoLand’s debugger provides a Variables view that displays variables’ current state, allowing you to examine their values. You can also add expressions to the Watches view to track specific variables.
You can also access built-in tools for error analysis and code navigation.
Here are some of the features and techniques you can use to leverage these tools effectively:
| Feature | Command(s) | Description |
|---|---|---|
| Syntax and Error Highlighting | N/A | GoLand automatically highlights syntax errors, semantic errors, and potential issues in your code. It uses red squiggly lines for syntax errors and different colors for other issues. You can hover over the highlighted code to see error messages and suggestions. |
| Code Inspections | Analyze menu or shortcut key combination (e.g., Ctrl+Alt+Shift+I) | GoLand provides code inspections to help detect and fix issues. It checks for code redundancies, performance optimizations, style violations, and more. Inspections can be run on specific files, packages, or the entire project using the “Analyze” menu or shortcut keys. |
| Error/Warning Exploration | F2 (or Cmd+Down on macOS) | When encountering an error or warning, you can navigate directly to the problematic code by clicking on the highlighted line or using the shortcut F2 (Cmd+Down on macOS). This action takes you to the relevant file and line, facilitating error inspection and resolution. |
| Go to Definition/Declaration | Ctrl+Click (or Cmd+Click on macOS), Ctrl+B (or Cmd+B on macOS) | The “Go to Definition” feature allows navigation to the definition or declaration of a function, variable, or type. Place the cursor on the symbol, press Ctrl+Click (Cmd+Click on macOS), or use the shortcut Ctrl+B (Cmd+B on macOS). |
| Find Usages | Right-click on symbol, select “Find Usages” | You can find a specific symbol’s usages in your codebase using the “Find Usages” feature. Right-click on a symbol and select “Find Usages” from the context menu. It will display a list of locations where the symbol is used, allowing you to navigate through them. |
| Code Structure Navigation | Ctrl+F12 (or Cmd+F12 on macOS) | GoLand provides a hierarchical view of your code’s structure, which you can access through the “Structure” tool window or by pressing Ctrl+F12 (Cmd+F12 on macOS). This view helps you navigate through different functions, methods, and types in your code quickly. |
| Refactoring Tools | Right-click on symbol or block of code, select refactoring option from context menu | GoLand includes a set of refactoring tools to assist you in code restructuring and maintenance. You can rename variables, extract functions, inline variables, and perform many other code transformations. Right-click on a symbol or a block of code and select the appropriate refactoring option from the context menu. |
| Quick Documentation Lookup | Ctrl+Q (or F1 on macOS) | To quickly view the documentation for a function, type, or package, you can use the “Quick Documentation Lookup” feature. Place the cursor on the symbol and press Ctrl+Q (F1 on macOS). It will display the relevant documentation, function signatures, and additional information. |
These are just a few examples of the error analysis and code navigation tools available in GoLand. The IDE offers many more features and shortcuts to enhance your coding experience. You can explore the documentation and experiment with the different functionalities to find the ones that best suit your workflow.
GoLand is a paid product; however, it is free for students and academic purposes. You can start a free 30-day trial and get a license.
You can also resort to use the Delve extension for VSCode for a wholesome, free development experience.
Conclusion
You’ve learned about debugging in Go, how to identify bugs, debugging tools, best practices for debugging, and how you can debug your Go programs with Delve and GoLand.
Debugging is an essential part of the software development cycle, so ensure you debug your apps before pushing them to production.

> Use structured logging libraries like zap or logrus
They have added a build-in structured logger in the Go 1.21 – https://go.dev/blog/slog
Great article, really instrumental. Bookmarked