Developers and Site Reliability Engineers, or SREs, traditionally work separately and use different tooling to achieve the same outcome of emulating the user workflow in their respective playgrounds. Synthetic Monitoring and End-to-End (E2E) testing are two approaches, owned by SREs and developers respectively, that both emulate the user path. With DevOps aiming to unite these two factions around similar processes to improve application stability, we need to unite around single tooling to validate and monitor the user experience from development through to production.
The reality is that Synthetic Monitoring can serve a means of testing new features and defects throughout the software development lifecycle. As you can see from the below diagram, the E2E testing performed at the development and peer review stages can also be transformed into monitors running against the production application as they both emulate user behavior.
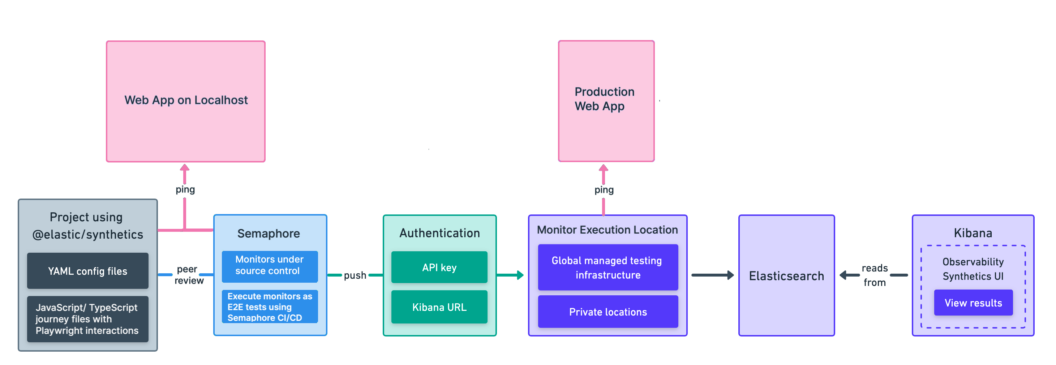
This tutorial makes use of @elastic/synthetics, the Playwright E2E testing and automation framework, and Semaphore and Elastic Synthetics dashboards to show how user journeys can be written together by both SREs and software engineers to validate user workflows and provide regular production monitoring with a single set of tools.
What is Synthetic Monitoring?
Synthetic Monitoring is the execution of automated scripts on a regular frequency to determine the availability of a running application. The key goal is to catch potential or ongoing instability issues before users report them.
Synthetic Monitoring involves two types of scripts:
- Lightweight monitors, or heartbeats, that will regularly ping an endpoint on a supported protocol such as HTTP, TCP or ICMP, to determine if it is alive. If a response is not received, SREs will want to be notified that the endpoint is unavailable.
- Browser monitors are scripts that will execute user interactions such as clicks and text entry against the site to validate that the application is available and able to process user workflows. Depending on how critical a given workflow is to users, SREs will want to be notified of failures or be able to detect performance degradation, using factors such as the time taken to execute the workflow, to preempt software outages.
Both of these monitoring types can help anticipate potential problems with our application in production, and gather useful information for investigating issues.
What is E2E testing?
E2E testing is a technique for mimicking user actions with our application, such as button clicks, to validate that their workflow and desired outcome are performed by the software in response to this interaction. E2E tests are typically run as part of local development and within continuous integration, or CI, pipelines to prevent the merging of breaking changes into our main repository branch.
So what is the connection between Synthetic Monitoring and E2E testing? Both E2E tests and browser monitors from Synthetic Monitoring emulate the user behavior and allow us to either test before deployment that the workflow can be executed against the current version of the software, or is still able to be performed against the production version of the application. By executing browser monitors instead of E2E tests, using a tool familiar to both developers and SREs, we can embody the common process ethos of DevOps and build a common understanding between these two groups regarding the features that are exposed to users.
Prerequisites
The browser monitors generated for production monitoring make use of the Synthetic Monitoring UI, known as Elastic Synthetics. Therefore, before starting, please ensure that the following setup has been completed:
- The Elastic cluster is set up either via your local installation or via Elastic Cloud, and Monitor Management has been enabled in Elastic Synthetics.
- The Synthetics app has been enabled in the Management tab, as per step 2 of the documented prerequisites.
- A note has been made of either the Elastic Cloud instance Cloud ID or on-prem Kibana endpoint to be specified when generating the monitor project using the creation wizard.
- A dedicated Project API key has been generated using the Elastic Synthetics application Settings as per the steps given in the Synthetics documentation. This key grants the required permissions for pushing your monitors from your Semaphore CI pipeline.
Generating your first monitor project
Once the above steps have been completed, the @elastic/synthetics wizard can be used to generate your first monitor project:
npx @elastic/synthetics init my-first-monitor-projectThe wizard will ask you to provide details including:
- The Cloud ID or Kibana endpoint of your Elastic cluster.
- The previously generated Project API key.
- How often, by default, monitors uploaded to Elastic Synthetics need to run, in minutes.
- The Kibana space to which the monitors should be uploaded. This is useful if applications are managed by separate teams and the monitors need to be placed in separate spaces to enforce access controls.
The wizard will generate a sample TypeScript project for you with examples to help you get started, similar to the below screenshot:
The key items highlighted include:
- The global monitor configuration present within
synthetics.config.ts, similar to this example in the demo project. This configuration serves as the default for all monitors within your project and can be overridden in individual journeys. - Sample lightweight monitors, under the
lightweight folder. Implemented using YAML-based Heartbeat configuration, these monitors ping the defined endpoint. Details on the configuration options of lightweight monitors are outside the scope of this tutorial. - Example browser monitors located under the
journeysfolder. These monitors make use of Playwright and TypeScript. It is these monitors that can be used in place of E2E tests to execute and validate user workflow in non-production and production environments.
Understanding monitor configuration
There are 3 key attributes within the `synthetics.config.ts configuration that you may need to change:
params.urldenotes the default URL of the site to be monitored. Using these monitors for testing and production purposes means thatparams.urlshould be overridden with a new value depending on the environment, as per the example on line 20.playwrightOptionsmonitor, which gives the default settings for all monitors located under the journeys folder.
The monitor configuration contains 3 key settings:
- The
scheduleattribute denotes the frequency monitors should be regularly run in Elastic Synthetics. For example, the defined valueschedule: 10will ensure that all monitors will run every 10 minutes unless overridden. locationsdenote the Elastic Infrastructure locations where the monitors will run.privateLocationsreferences any private locations where you are running your monitors. These should be configured in Elastic Synthetics.
Writing your first user journey
Let’s write our browser monitor to live alongside the generated ones in the journeys folder, hereafter referred to as user journey. A new user journey can be written using the @elastic/synthetics Playwright wrapper and Typescript, or recorded and saved using the Elastic recorder for those less comfortable writing Playwright code. Further examples are also available in this demo project.
Playwright gives you a great API to mimic user actions to reflect the user journey through your application, as well as useful extensions to get elements. The @elastic/synthetics wrapper provides the journey and step wrappers on top of the monitor configuration discussed previously. The benefit of these keywords is they invoke the user perspective and the idea of steps users need to perform to interact with the product. This lends itself to techniques such as Behavior-Driven Development, or BDD, where we write tests in a user behavior format rather than traditional assertion-based unit tests.
An example journey showing the key structure of these monitors is given below:
import { journey, step, monitor, expect } from '@elastic/synthetics';

journey('My First Journey', ({ page, params }) => {
  // Override global monitor configuration for this journey
  monitor.use({
    id: 'my-app-monitor',
    schedule: 3,
  });

   // Setup our journey
   before(async () => {
    await page.goto(params.url);
   });

   // A sample step in the user journey
   step('assert home page loads', async () => {
    const header = await page.locator('h1');
    expect(await header.textContent()).toBe('My App');
   });

   step('assert move to login page', async () => {
    const orderButton = await page.getByTestId('login-button');
    await orderButton.click();

    const url = page.url();
    expect(url).toContain('/login');

    const autoLoginOptions = await page.getByTestId('login-options');
    expect(await autoLoginOptions.count()).toBeGreaterThan(2);
   });

   // Post-journey events
   after(() => {
    console.log('Suite complete!');
   });
});
The best practice of using the data-testid CSS attribute to segregate your selectors from CSS and JS changes is present in step assert move to login page in the above example. This reduction in test brittleness is recommended in the author’s opinion, which you can see in action through the use of Playwright’s getByTestId selector.
Pushing your monitors within Semaphore
Upon committing your first journey and monitor configuration, it’s time to create a CI pipeline using Semaphore. The getting started documentation gives a step-by-step overview of how to create your first pipeline using the UI.
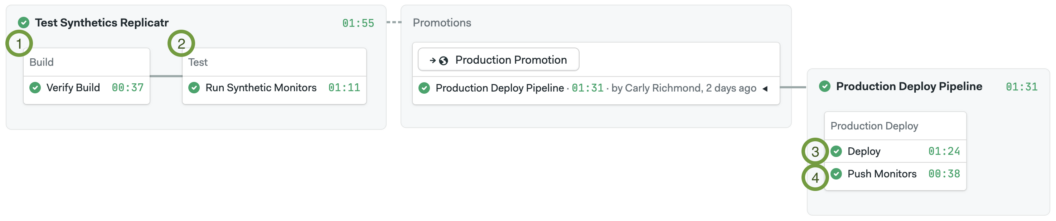
Like many workflows that developers are familiar with, the first pipeline – Test Synthetics Replicator – builds and tests the website and caches the distribution. This is then deployed later in the second pipeline: Production Deploy Pipeline.
As shown in the above diagram, 4 key steps in the CI pipeline will be discussed in subsequent sections.
1. Build application
Step 1 builds the application and caches the results, allowing you to validate that your application is building successfully.
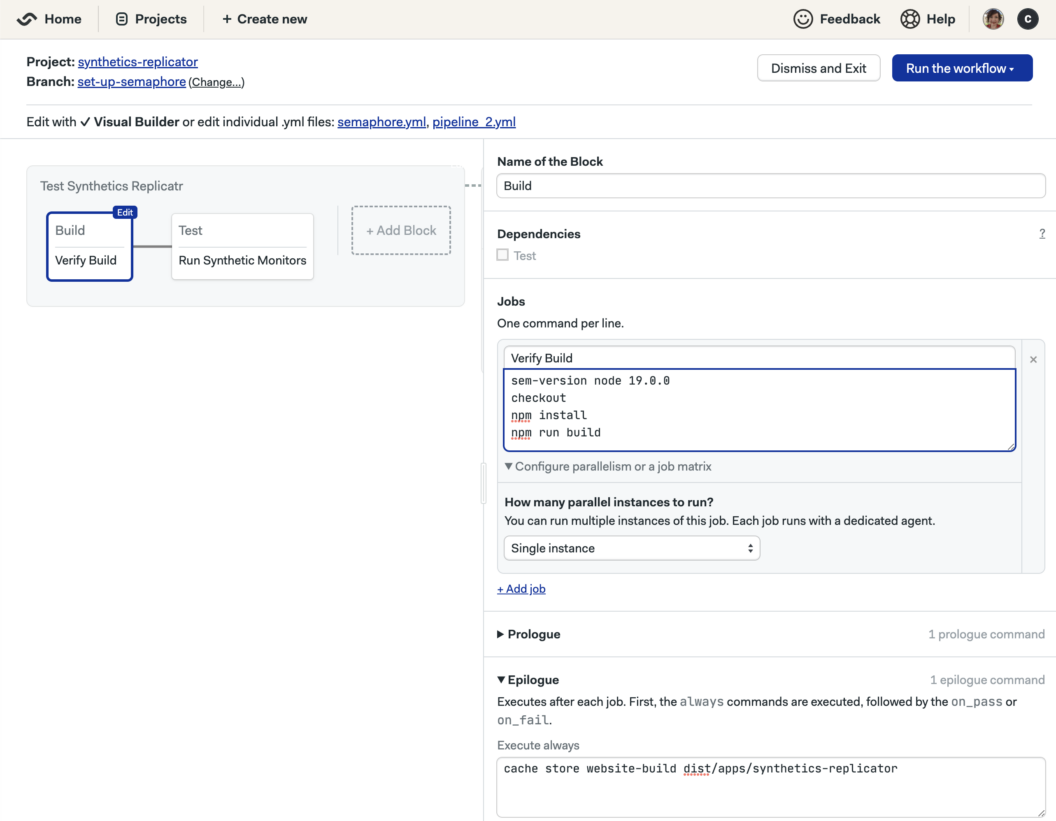
The build step looks like this:
sem-version node 19.0.0
checkout
npm install
npm run build
Caching the result with the public folder structure in the epilogue allows this version to be used later to deploy the site to Netlify without needing to rebuild the application. Caching them under the folder structure required for our Netlify deployment looks like this:
cache store website-build dist/apps/synthetics-replicator2. Test using Synthetic Monitors
Stage 2 starts a locally running version of the website and executes the monitors programmatically against the site to validate that the suite of user journeys pass. This means we are using the Synthetic Monitors in a similar fashion to e2e testing that developers already use today. Usage of the elastic/synthetics execution is shown below:
sem-version node 19.0.0
checkout
npm install
npm start &
cd apps/synthetics-replicator-tests/journeys && npm install @elastic/synthetics && SYNTHETICS_JUNIT_FILE='junit-synthetics.xml' npx @elastic/synthetics . --reporter=junit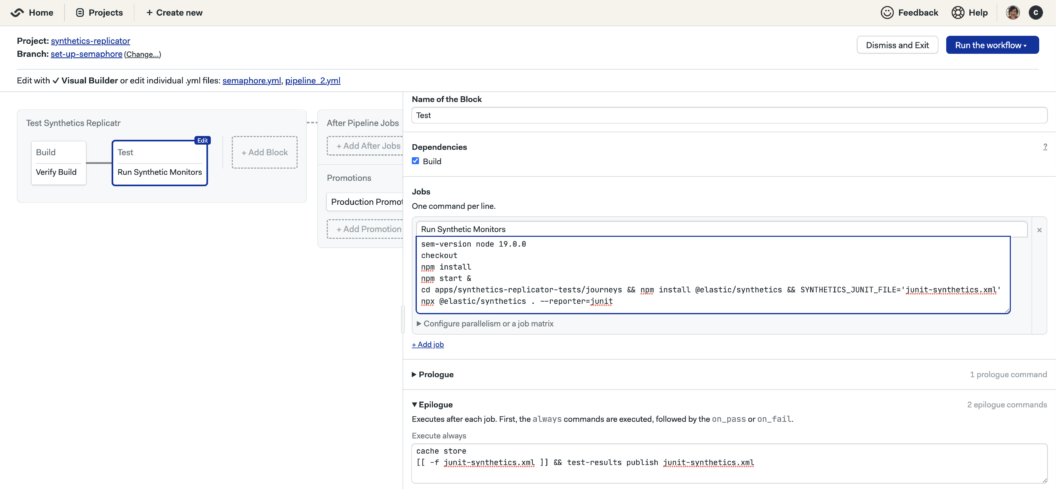
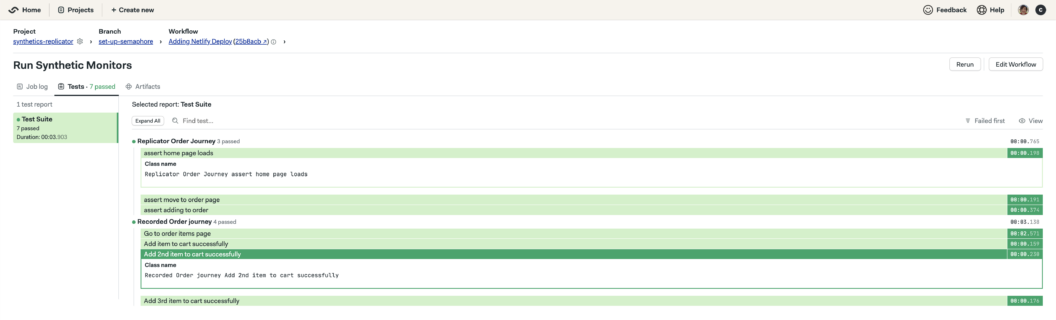
Within a pipeline execution, Semaphore can pick up XML test result reports to show successful and failed journeys. The documentation shows how to publish the generated file in JUnit format using an epilogue step:
cache store
'[[ -f junit-synthetics.xml ]] && test-results publish junit-synthetics.xml'
The published report can then be viewed in the Semaphore UI test results tab:
Deploy
The application is deployed in step 3 using a previously-cached build to your hosting source such as Netlify. The Semaphore Netlify documentation gives steps to generate the required key and upload it as secret netlify-authentication. Please also ensure that Semaphore is added as a permitted application within your Netlify settings. The full command and configuration for deploying our application looks like the following:
npm install netlify-cli -g
cache restore website-build
netlify deploy --dir=dist/apps/synthetics-replicator --prod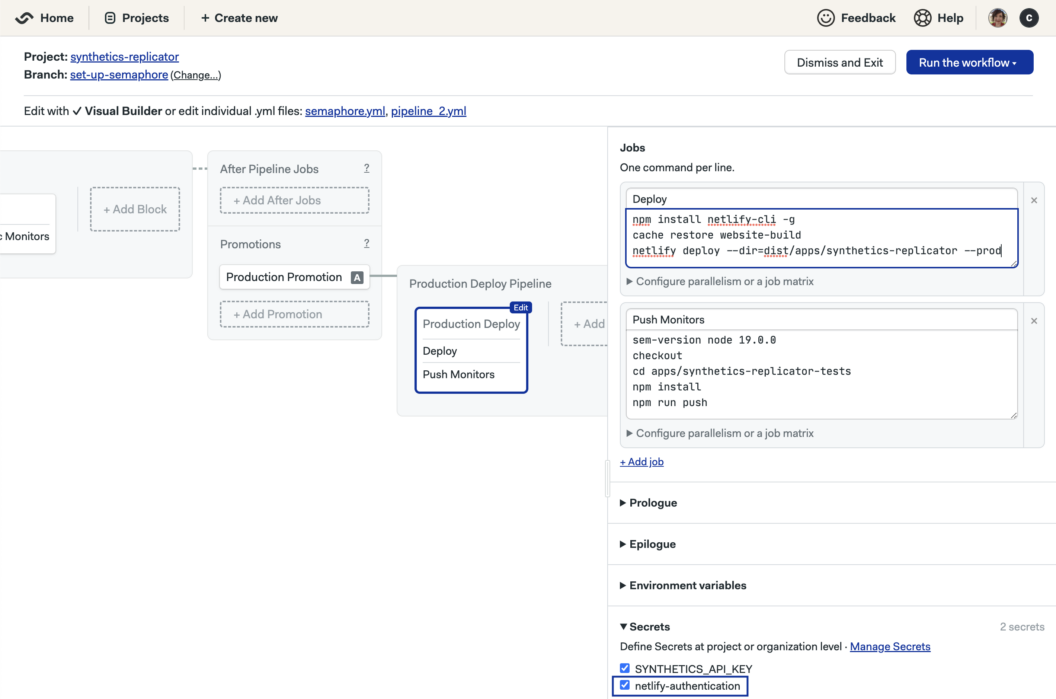
Semaphore allows configuration of jobs and promotions to be executed after a pipeline. Conditions are used in the dependent workflow Test Synthetics Replicator to ensure that the promotion is triggered automatically on a successful build from master. The promotion configuration looks like this:
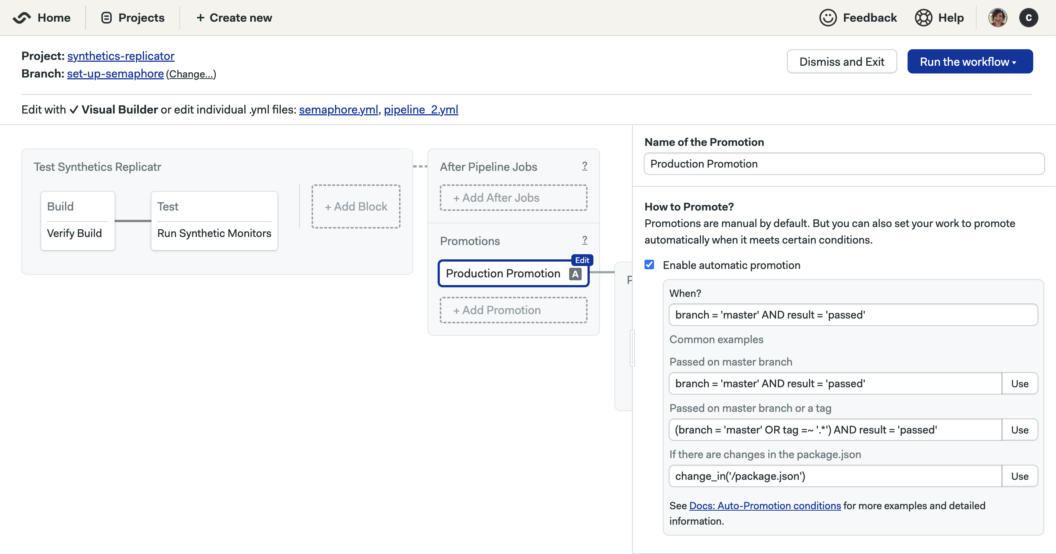
Promote browser monitors to production
Stage 4, the last step in our pipeline, deploys our application and pushes the monitors to Elastic Synthetics and will run the monitors from the specified locations against the production application. The commands listed in the Push Monitors step will obtain and push the monitors based on the configuration discussed previously:
npm install netlify-cli -g
cache restore website-build
netlify deploy --dir=dist/apps/synthetics-replicator --prod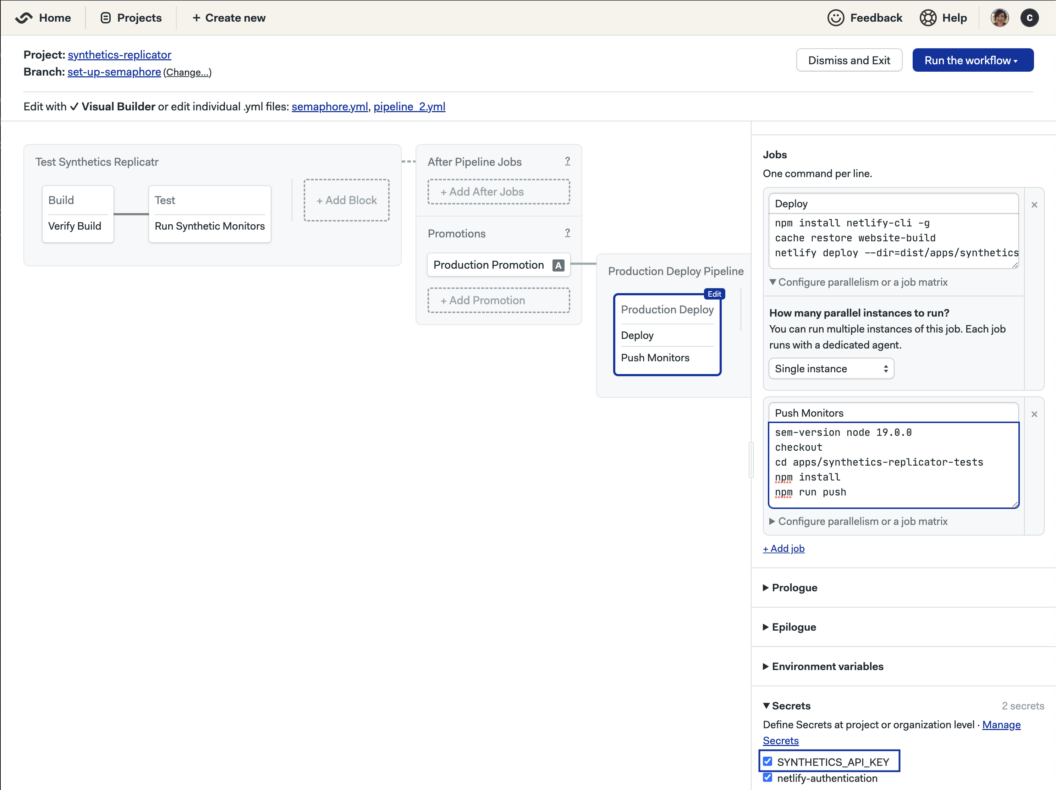
Note that the API key generated previously as part of the prerequisites must be stored as a secret SYNTHETICS_API_KEY to be used by the push command. Do not make your secrets publicly available in your pipeline configuration!
Pushing any updates to monitors to Elastic Synthetics for monitoring our application in production needs to be done at production deployment time. Pushing at this stage ensures our monitors remain in sync with the latest production site. Having out-of-sync user browser monitors can cause monitor failures that reduce the ability of SREs to monitor and identify issues such as bottlenecks and user errors.
Monitoring production using Elastic Synthetics
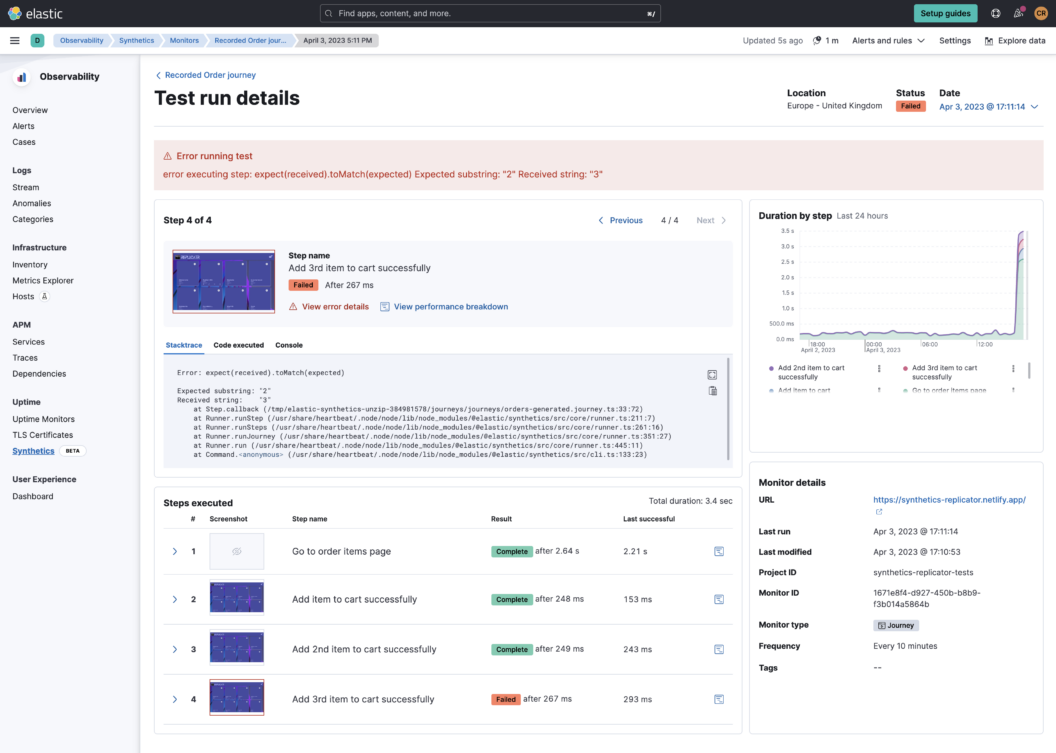
Pushing the browser monitors to Elastic Synthetics is the connection between developers and their SRE colleagues. Running these monitors regularly every few minutes ensures that SREs can identify failures quickly. They are also able to scrutinize the duration trend of a given workflow to look for potential performance degradation, as illustrated in the screenshot below:
Call to action!
As long as developers and SREs are interested in validating or monitoring the state of the user workflow, it’s essential to use common tools whenever possible. Regardless of which domain you belong to, make use of @elastic/synthetics, Playwright E2E testing and automation framework, Semaphore and Elastic Synthetics to both validate user workflows and provide regular production monitoring with a single set of tools.
To find out more, check out the Synthetic Monitoring documentation. Happy monitoring!