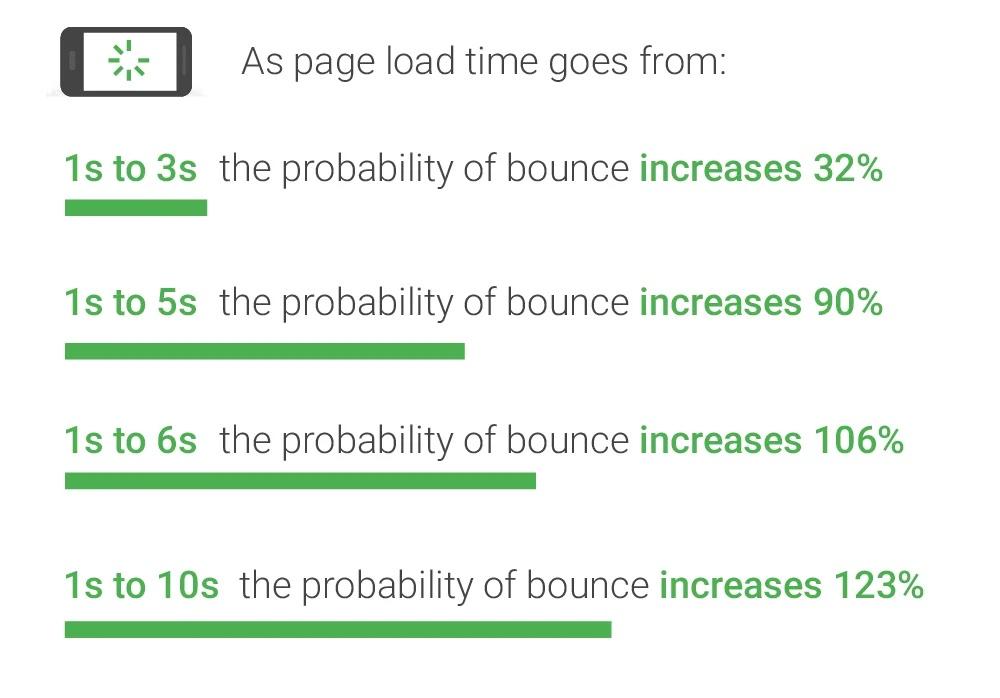
Page speed matters more than you think. According to research by Google, the probability of users staying on your site plummets as loading speed slows down. A site that loads in 10 seconds increases the bounce rate by a whopping 123%. In other words, speed equals revenue.
How can we ensure that our pages are loading at top speed? The answer is to measure them regularly with Lighthouse and CI/CD.
Measuring page speed with Lighthouse
Lighthouse is a page speed benchmark tool created by Google. It runs a battery of tests against your website and produces a report with detailed advice to improve performance.
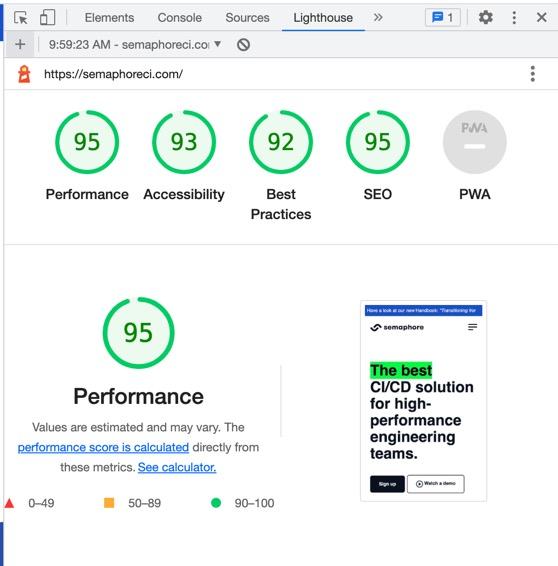
⚠️ You might be surprised at the low scores Lighthouse presents. This is because the tool simulates mid-tier mobile devices on a 4G connection.
While Lighthouse’s primary focus is performance, it can assess other things like:
- Accessibility: suggests opportunities to make the content more accessible. This covers ensuring that the page is optimized for screen readers, all elements have labels, or the site is browsable with the keyboard.
- Best practices: checks for various sane practices that improve speed and security.
- SEO: performs various checks to ensure that the page is SEO-optimized.
- PWA: ensures the page passes progressive web application tests, which improves user experience on mobile devices.
4 ways of running Lighthouse
Lighthouse is an open-source project that you can run in different ways:
- Since it is included in Google Chrome, you can run it directly from the browser. Click on More tools > Developer Tools and open the Lighthouse tab.
- If you have Node installed, you can run npm install -g lighthouse and run the tool in the command line like this: lighthouse https://semaphoreci.com
- You can include it in your code as a Node package.
- And finally, Lighthouse has a CI version you can run in your continuous integration. We’ll use this method to schedule periodical benchmarks.
Setting up Lighthouse CI
In order to run Lighthouse CI, you’re going to need the following:
- Google Chrome.
- A GitHub or Bitbucket account.
- The LTS version of Node.
Let’s get started by installing Lighthouse CI with: npm install -g @lhci/cli
Next, create a config file called lighthouserc.js. The URL parameter is an array of websites to benchmark. We can adjust the numberOfRuns, as more runs yield more statistically-relevant results.
// lighthouserc.js

module.exports = {
  ci: {
    collect: {
        url: ['https://semaphoreci.com'],
        numberOfRuns: 1
    },
    upload: {
      target: 'filesystem',
      outputDir: 'reports'
    }
  }
};
Bear in mind that, while Lighthouse is not particularly heavy on resources, setting the number of runs to a high value can make the job take too long to complete. Never forget that you want your CI pipeline to run in than 5 to 10 minutes, not more than that.
Now we can run Lighthouse with: lhci autorun. When finished, we’ll find a few files in the reports folder:
manifest.json: contains a list of the reports generated.$url-$timestamp-report.htmlis the main report you can open with any browser.$url-$timestamp-report.json: the same report in JSON version.
Using Lighthouse for non-functional testing
Lighthouse lets us configure limits for each category. When one of these values falls below a predefined value, the tool stops the CI pipeline.
For example, let’s say we don’t want the ratings of our site to fall below 80% in all categories. To achieve that, we need to add assertions to the config file:
// lighthouserc.js

module.exports = {
  ci: {
    collect: {
        url: ['https://semaphoreci.com', 'https://semaphoreci.com/blog'],
        numberOfRuns: 5
    },
    upload: {
      target: 'filesystem',
      outputDir: 'reports'
    },
    // enforce limits
    assert: {
      assertions: {
        'categories:performance': ['error', {minScore: 0.8}],
        'categories:accessibility': ['error', {minScore: 0.8}],
        'categories:seo': ['error', {minScore: 0.8}],
        'categories:best-practices': ['error', {minScore: 0.8}]
        }
    }
  }
};
Measuring page speed with CI/CD
The next step is to automate Lighthouse with CI/CD. And for that, we’ll need to create a code repository and a Node project.
- Create and clone a repository on GitHub or Bitbucket.
- Initialize a Node project with
npm init - Add Lighthouse CI as a dependency:
npm add @lhci/cli - Add a start script in
package.json:
"scripts": {
	"start": "lhci autorun",
},
Do a trial run with: npm start
When done, you should have the following files in your project:
├── lighthouserc.js
├── node_modules
├── package-lock.json
├── package.json
├── reports
    ├── manifest.json
    ├── semaphoreci_com-_-2022_10_26_12_58_56.report.html
    ├── semaphoreci_com-_-2022_10_26_12_58_56.report.json
If everything checks out, commit your files to the remote repository.
Continuous benchmarking with CI/CD
Now it’s time to run the project with Semaphore.
We’re going to schedule Lighthouse benchmarks with Semaphore. If you’ve never used Semaphore before, check the starting guide first.
Let’s create a CI pipeline that runs Lighthouse CI:
- Add your GitHub or Bitbucket repository to Semaphore.
- Select “Single Job” as a starting workflow and click on Customize.
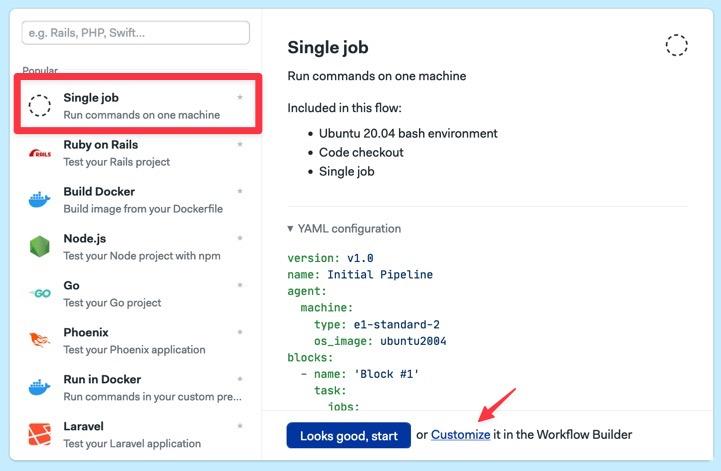
- Type the following commands into the first block:
checkout
sem-version node 18
cache restore
npm install
cache store
npm start- Open the Epilogue section, which is always executed even when the job fails, and type the following commands to save the reports in permanent storage.
artifact push workflow reports
for f in reports/*.html; do artifact push project "$f"; done- Start the workflow with Run workflow.
What did we get for all this work? We now have a pipeline that scans the website and throws an error if it fails to make the cut.
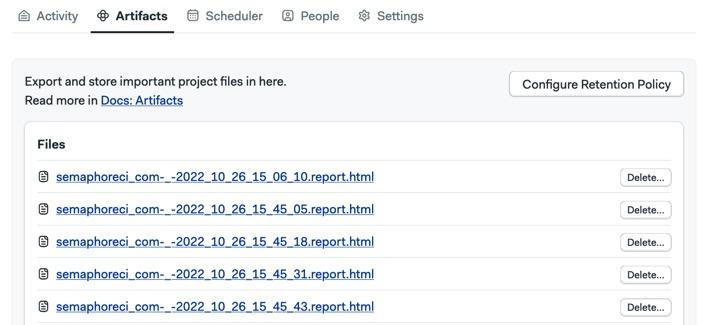
You can check all the reports in the project’s Artifacts tab.
Scheduling and setting a retention policy
Semaphore will, by default, run the pipeline on every commit to the repository. This works great when you’re using Lighthouse during development. But we need more if we want to monitor a live page.
We need a scheduler:
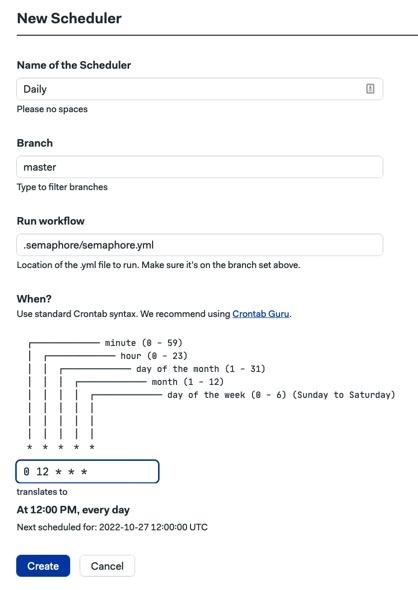
- Open the Scheduler tab in your Semaphore project and Click New Scheduler.
- Define how often you want to run the checks.
The following example runs a check every day at 12 PM:
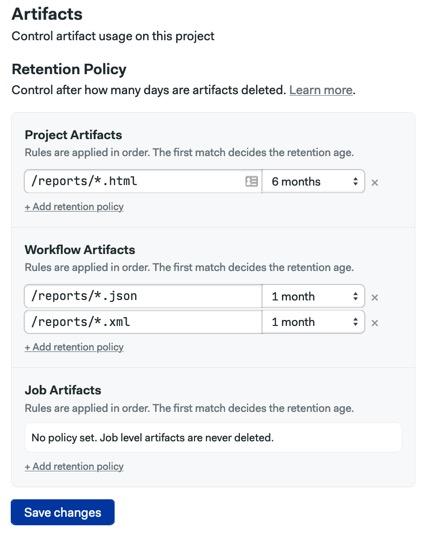
The final step is to configure a retention policy to delete old reports:
- Go to the Project Settings tab.
- Click on Artifacts
- Set retention policies for each file type in the reports folder.
The following example sets a 6-month retention for HTML reports and 1-month retention for the rest of the files.
As a final touch, you can set up Slack notifications to get pinged when tests fail.
How to analyze the results
Our setup works, but I see a couple of problems with it:
- We must delve into the CI logs when the test fails.
- We can only test the settings supported by Lighthouse CI.
If these are problems for you, let’s explore some ideas to improve the testing.
Setting up a dashboard
The Lighthouse CI project includes an optional dashboard that lets you browse historical data and find trends.
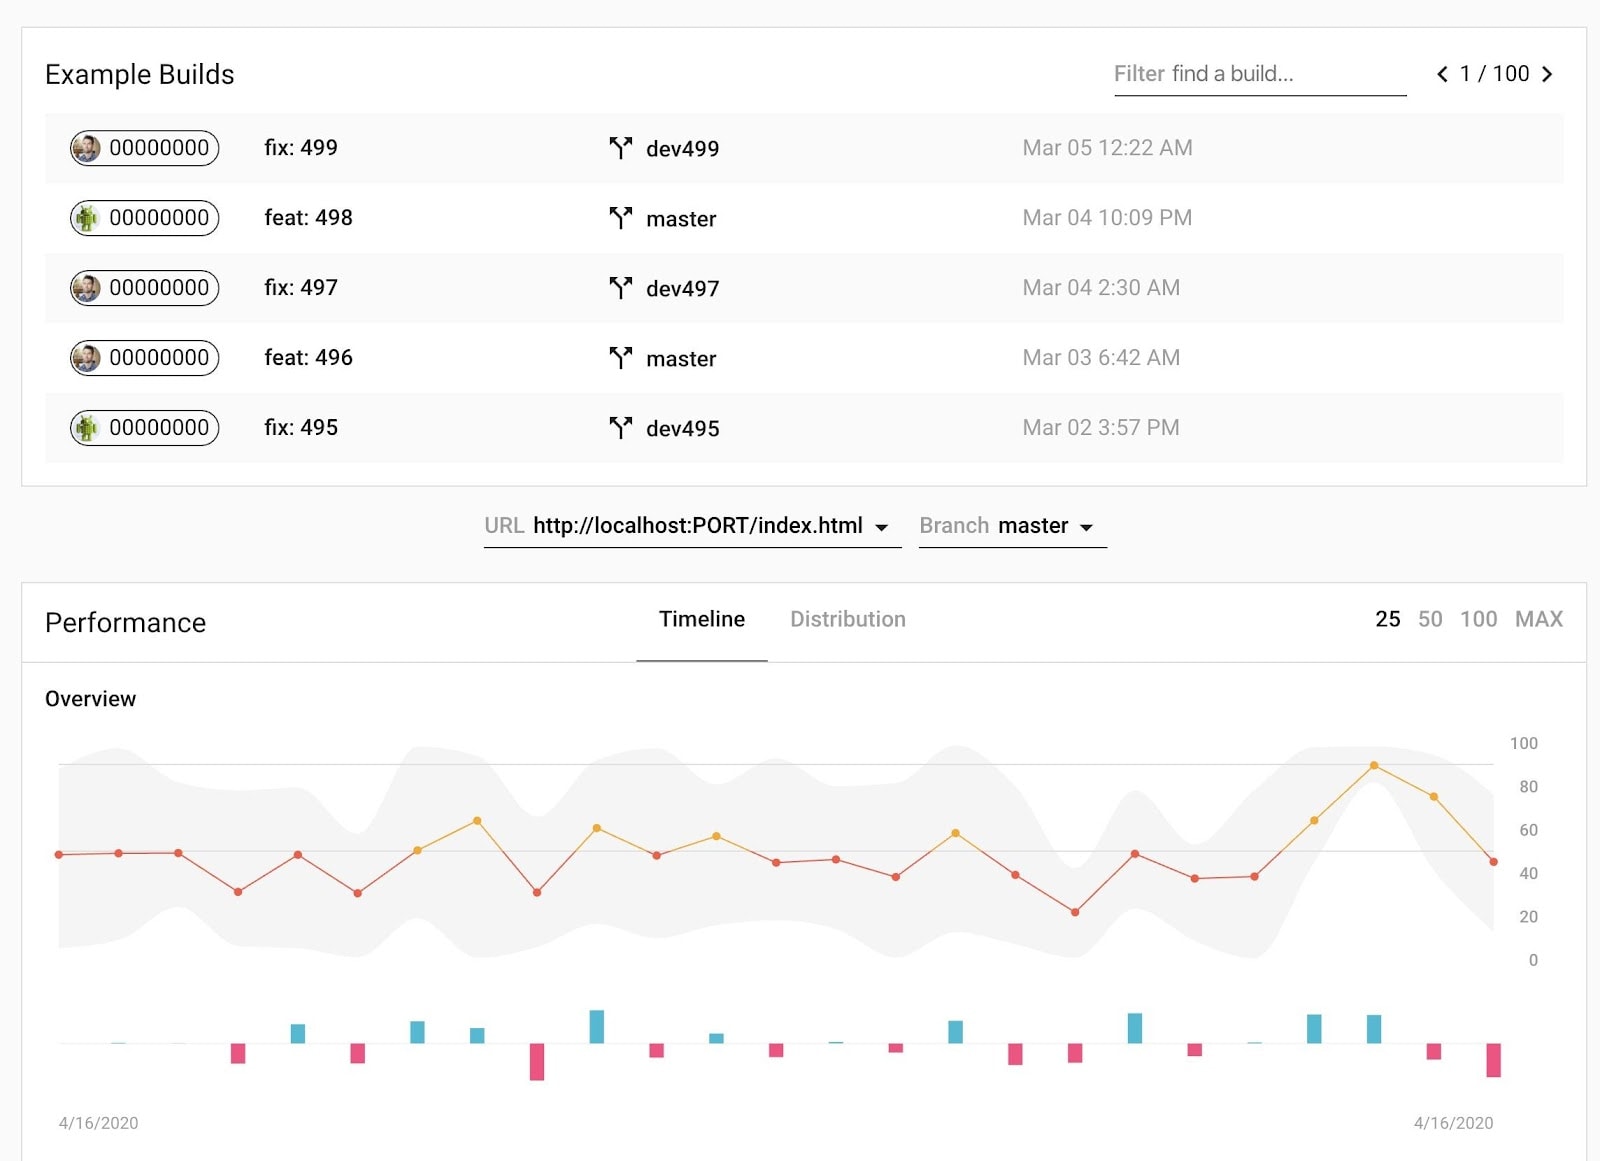
Installing the dashboard requires a separate server and database. You’ll need a dedicated machine and persistent storage to save historical data.
The downside of this approach is obvious — you need to manage yet another server. But it may be worth doing if you have a lot of sites to analyze.
Previewing test results on Semaphore
If installing a dedicated server is overkill, you can still get a better experience and more insights with Semaphore’s test reports. This feature allows you to visualize all tests at a glance.
This approach has the added benefit of letting you write your own tests. That means you can do all kinds of fine-grained validations. For instance, you can fail a test if the page doesn’t use HTTPS, uses deprecated Web APIs, or the project doesn’t include a PWA manifest.
To make this work, however, you’ll need to do a little bit of work:
- Open lighthouserc.js and remove all the assertions (or set them to warn instead of error) so the scanning job never fails.
- Install your favorite testing framework.. It must support the JUnit XML reports, so I recommend Jest with Jest-Junit.
- Write some tests, ensuring they produce JUnit reports. You can parse manifest.json and the JSON reports and make assertions depending on your needs.
- Add an audit action in package.json:
"scripts": {
	"start": "lhci autorun",
	"audit": "jest --ci"
},- Push the changes to the repository.
- Add a second job in your pipeline to audit the results.
checkout
sem-version node 18
artifact pull workflow reports
cache restore
npm run audit- Add the publish and collect commands as described in the test results documentation.
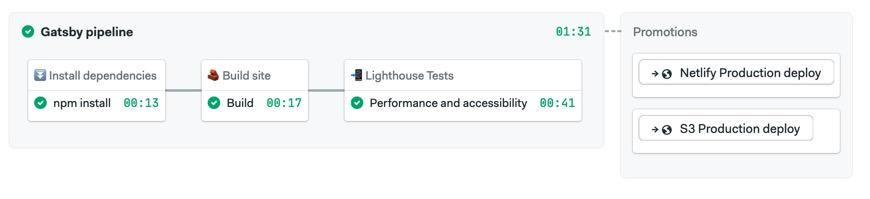
You can check a working example at my GitHub repository:
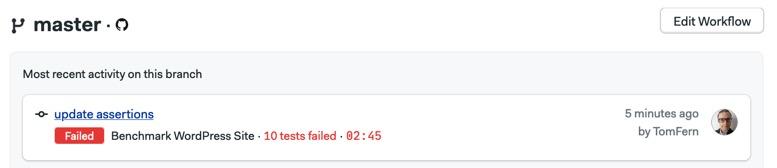
Now you can preview how many tests failed on the Activity tab:
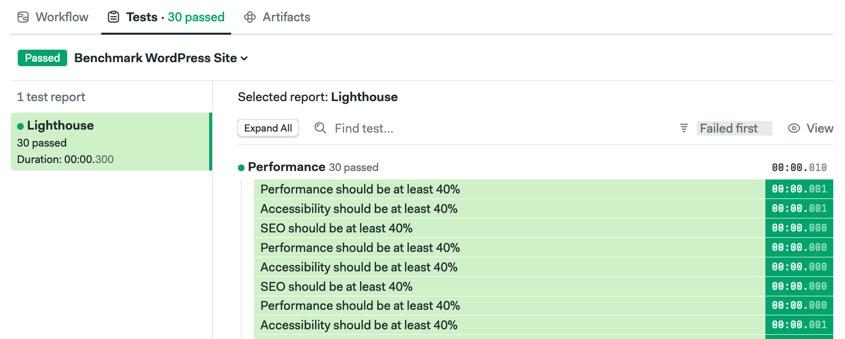
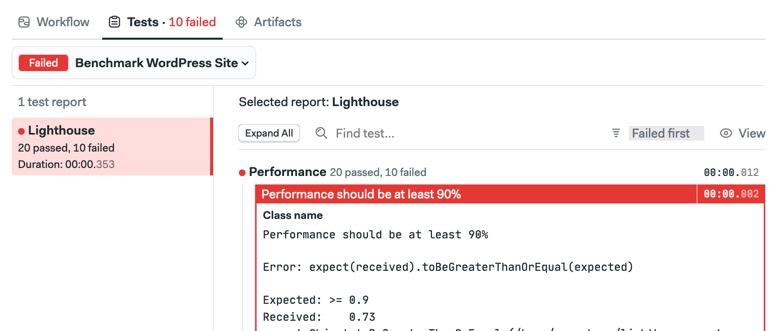
And you’ll find a detailed test summary report for each run in the Test tab:
Running Lighthouse in web development
We’ve only focused on testing an existing and running website. But a setup like this can perform non-functional tests during web development. You can, for instance, fail commits that make the site perform worse or break accessibility rules.
Time is money
Users are drawn to fast and responsive websites. The problem is that measuring page speed reliably is challenging since you cannot assume that everyone is on a fast connection and uses a top-tier device. With Lighthouse in your CI/CD pipeline, you can get results closer to real-life conditions and insights to help you continually improve.
Thanks for reading!