Having comprehensive logs is a massive life-saver when debugging or investigating issues. Still, logging too much data can have the adverse effect of hiding the actual information you are looking for. Because of these issues, storing your log data in a structured format becomes very helpful. Also, being able to track the number of occurrences and monitor their rate of change can be quite indicative of the underlying causes. This is why we decided to include the ELK stack in our architecture.
I’ll introduce you to one possible solution for sending logs from various separate applications to a central ELK stack and storing the data in a structured way. A big chunk of Semaphore architecture is made up of microservices living inside Docker containers and hosted by Amazon Web Services (AWS), so ELK joins this system as the point to which all of these separate services send their logs, which it then processes and visualizes.
In this article, I’ll cover how to configure the client side (the microservices) and the server side (the ELK stack).
Client-side Configuration
Before developing anything, the first decision we needed to make was to pick a logging format. We decided on syslog, which is a widely accepted logging standard. It allows for a client-server architecture for log collection, with a central log server receiving logs from various client machines. This is the structure that we’re looking for.
Our clients are applications sitting inside Docker containers, which themselves are parts of AWS ECS services. In order to connect them to ELK, we started by setting up the ELK stack locally, and then redirecting the logs from a Docker container located on the same machine. This setup was useful for both development and debugging. All we needed to do on the client side was start the Docker container as follows:
docker run --log-driver=syslog --log-opt syslog-address=udp://localhost:2233
We’ll assume here that Logstash is listening to UDP traffic on port 2233.
Once we were done developing locally, we moved on to updating our ECS services. For this, all we needed to do was update our task definition by changing the log configuration of the container:
{
  "containerDefinitions": [
    {
      "logConfiguration": {
        "logDriver": "syslog",
        "options": {
          "syslog-address": "udp://:2233"
        }
      }
    },
    ...
  ],
  ...
}
This started our Docker containers with the same settings we previously used locally.
Server-side Configuration
On the server side, we started with the Dockerized version of the ELK stack. We decided to modify it so that it accepts syslog messages, and enable it to read the custom attributes embedded inside our messages (more on that in the ‘Processing’ section below). For both of these, we needed to configure Logstash. In order to do that, we needed to look into the config/logstash.conf file.
Logstash pipeline consists of input, filter, and output sections. Inputs and outputs describe the means for Logstash to receive and send data, whereas filters describe the data transformations that Logstash performs. This is the basic structure of a logstash.conf file:
# logstash/config/logstash.conf input { tcp { port => 5000 } } #Add your filters / logstash plugins configuration hereoutput { elasticsearch { hosts => "elasticsearch:9200" } }
Receiving Messages
In order to receive syslog messages, we expanded the input section:
input {
  udp {
    port => 2233
    type => inline_attributes
  }
}
This allowed Logstash to listen for UDP packets on the specified port. type is just a tag that we added to the received input in order to be able to recognize it later on.
Now, since our ELK stack components are sitting inside Docker containers, we needed to make the required port accessible. In order to do that, we modified our docker-compose.yml by adding port “2233:2233/udp” to Logstash:
services:
  logstash:
    ports:
      - "2233:2233/udp"
      ...
    ...
  ...
...
Since we’re hosting our ELK stack on AWS, we also needed to update our task definition to open the required port. We added the following to the portMappings section of our containerDefinition:
{
  "containerDefinitions": [
    {
      "portMappings": [
        {
          "hostPort": 2233,
          "containerPort": 2233,
          "protocol": "udp"
        },
        ...
      ]
    },
    ...
  },
  ...
}
Processing
For processing, we decided to add the ability to extract key=value pairs from our message strings and add them as attributes to the structure that is produced by processing of a message. For example, the message … environment=staging … would produce a structure containing the key environment with the value staging.
We implemented this by adding the following piece of code into the filters section:
  ruby {
    code => "
      return unless event.get('message')
      event.get('message').split(' ').each do |token|
        key, value = token.strip.split('=', 2)
        next if !key || !value || key == ''
        event.set(key, value)
      end
    "
  }
The Ruby plugin allowed us to embed the Ruby code inside the configuration file, which came in very handy. Another useful thing we did at this point was to enable the outputting of processed messages to the console by adding the following to the output section:
stdout { codec => rubydebug }
Finally, we logged the following string in a client application:
“Some text service=service1 stage=stage1”
This produced the following event in the console debug, showing us the structure that gets persisted once the message has been processed:
{
     "message" => "<30>Nov  2 15:01:42  [998]: 14:01:42.671 [info] Some text service=service1 stage=stage1",
    "@version" => "1,
  "@timestamp" => "2016-11-02T14:01:42.672Z",
        "type" => "inline_attributes",
        "host" => "172.18.0.1",
     "service" => "service1",
       "stage" => "stage1"
}
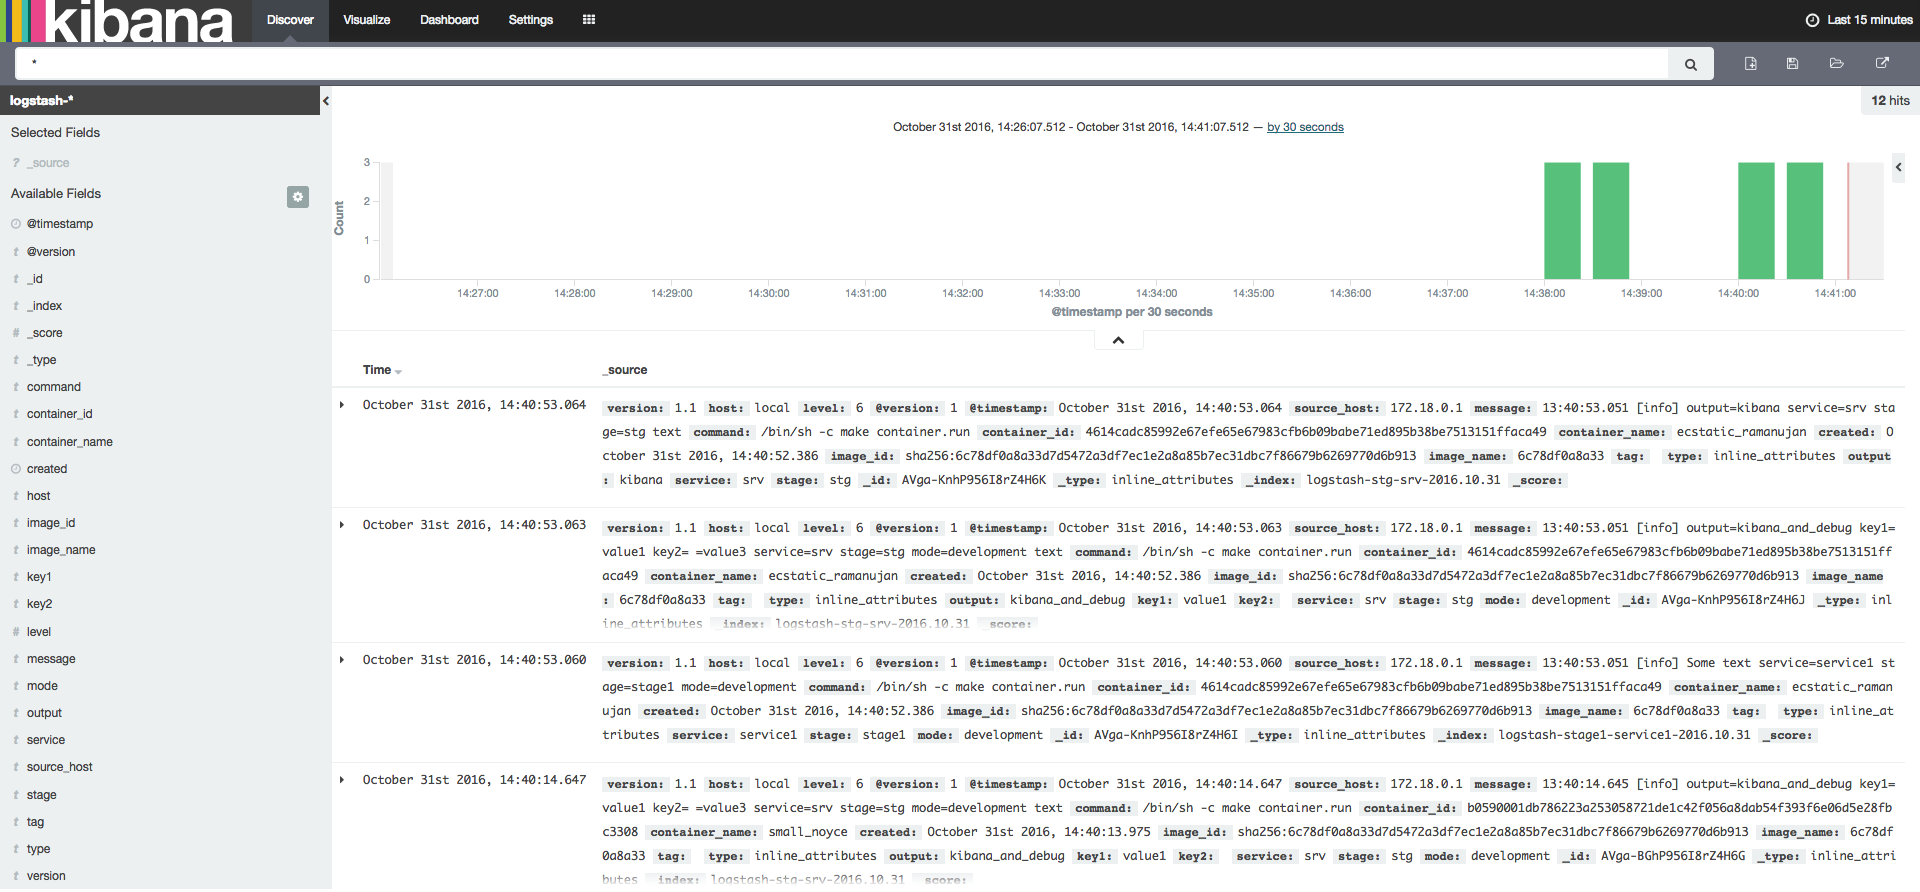
Note that service=service1 and stage=stage1 were added as attributes to the final structure. This final structure is then available for searching and inspection through Kibana’s GUI, as seen below:
Wrap-up
This sums up the logging setup. The result is a centralized logging system that can include new service logs with minimal setup on the client side. This allows for us to analyse logs quickly and efortlessly, as well as visualise the logs of various separate services through Kibana’s GUI.
This is the first post on our brand new engineering blog. We hope that you’ll find it useful in setting up your logging architecture. Speaking of useful, we also hope that you’ll trust Semaphore to run the tests and deploy your applications for you.
Happy building!